The Monterey Peninsula's $5 Million-Plus Real Estate Market in 2026: What the Data Actually Shows
A data-backed analysis for buyers and sellers navigating Carmel, Pebble Beach, Big Sur, and the rest of the Peninsula at the top of the market.
Forty-four homes sold for $5 million or more on the Monterey Peninsula through the first seven months of 2026, totaling $451.7 million in closed volume. That's the headline. It's also close to useless on its own, because an aggregate number tells you almost nothing about how this market actually behaves if you're the one trying to buy or sell at this level right now.
So I pulled every closed transaction of $5 million or more recorded in MLSListings for Monterey County between January 1 and July 29, 2026, and analyzed it the way I'd analyze it for a client. Not to build a case for anything. Just to see what the numbers say. Here's what they say.
The headline numbers
Median sale price across all 44 closings was $7.19 million. Mean was $10.3 million, pulled up by a handful of outsized sales at the very top. Prices ranged from exactly $5 million to $35.75 million.
Thirty-two of the 44 sales, or 73%, closed between $5 million and $10 million. The remaining 12 sales, just over a quarter of the transactions, closed above $10 million and accounted for $234.5 million, essentially half the total dollar volume. A small number of ultra-high-end closings are doing a disproportionate amount of the work in that headline figure, which matters if you're benchmarking your own listing or offer against "the market" without first checking which half of the market you're actually in.
Where the money is actually going
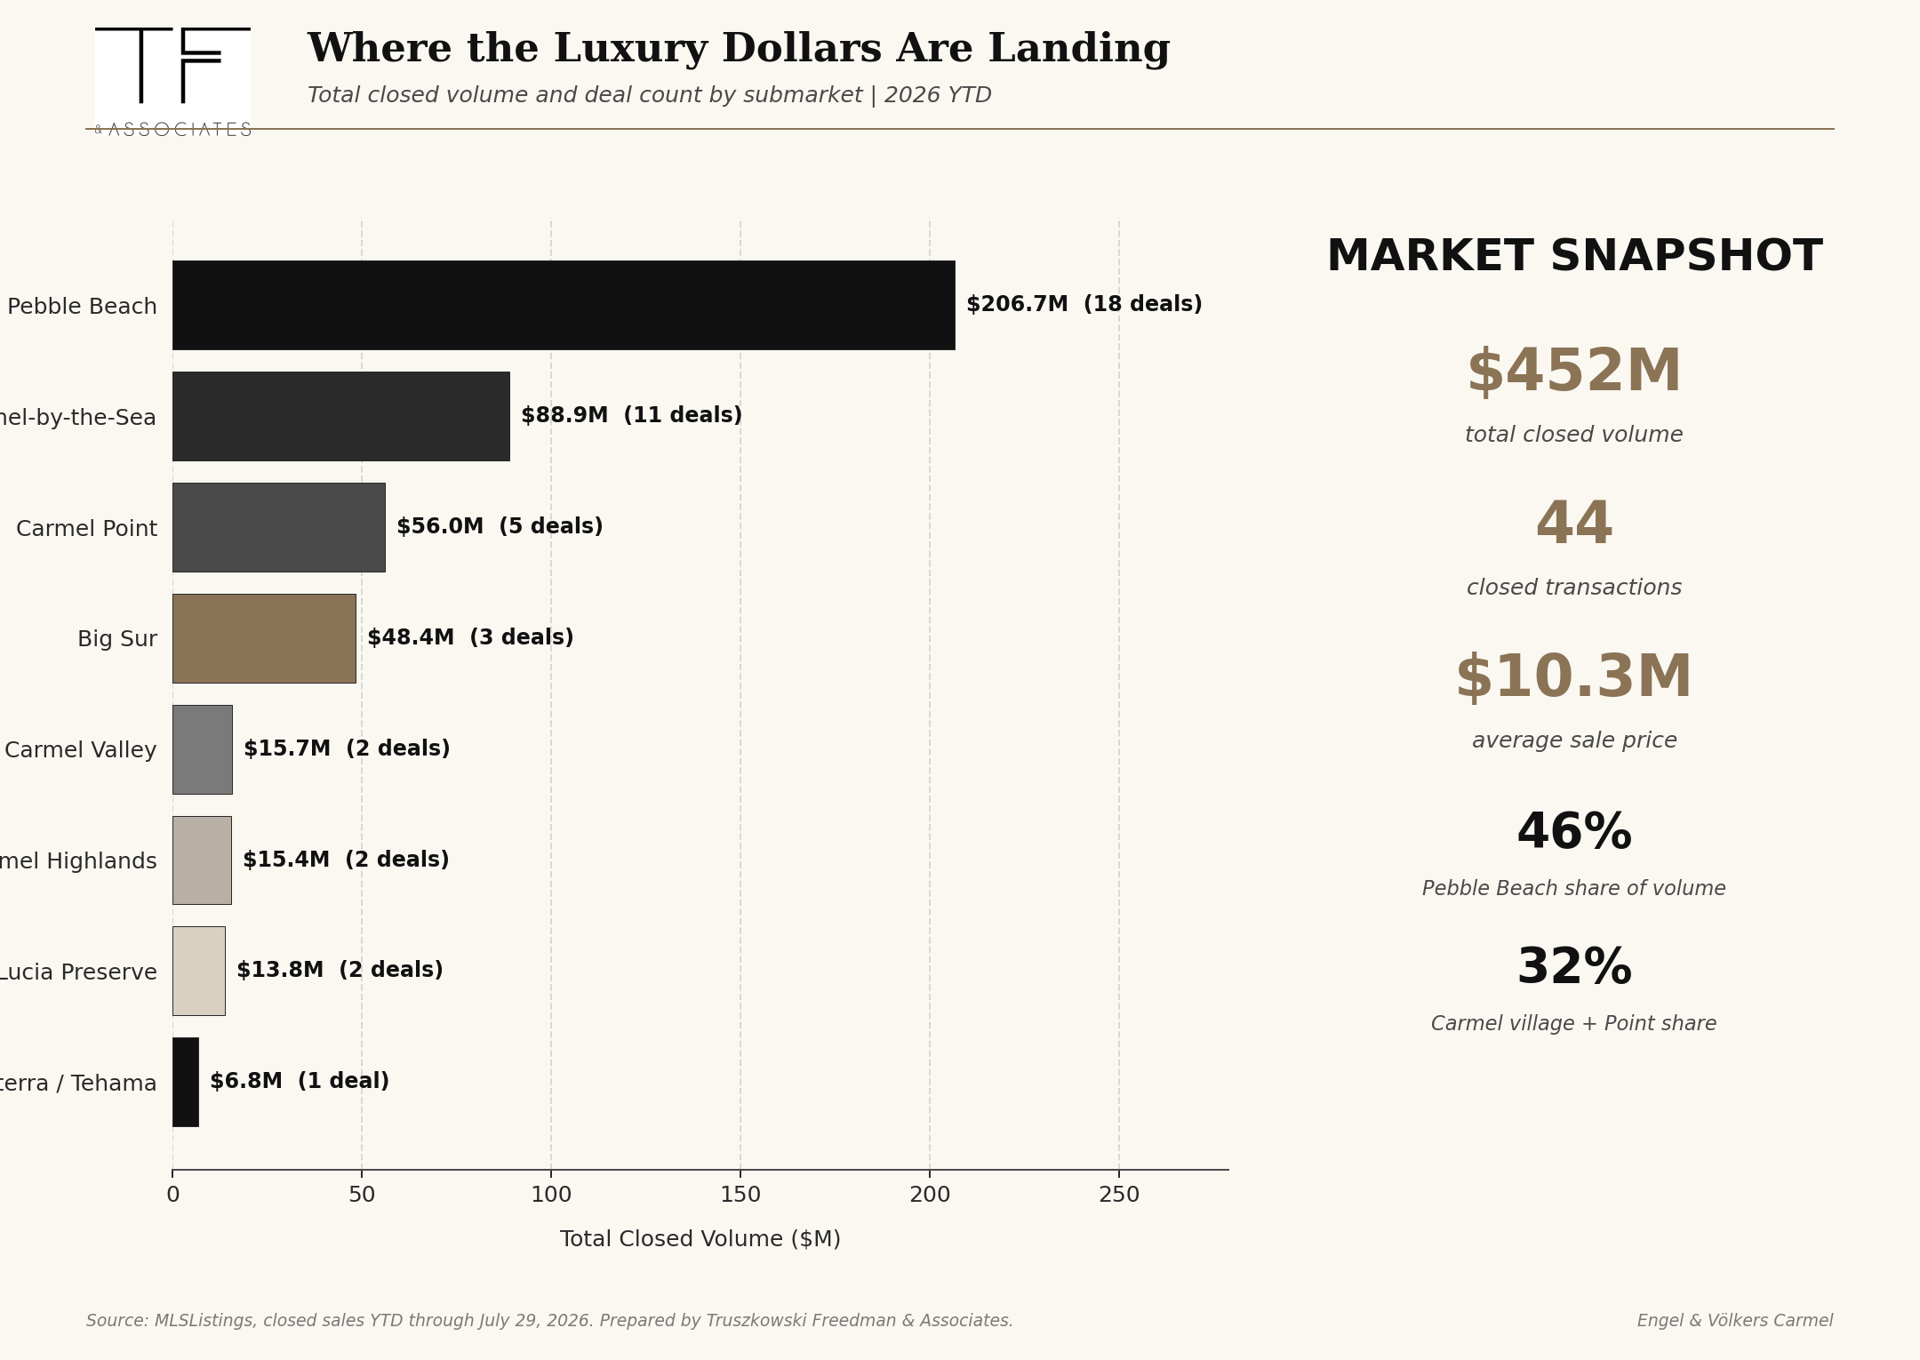
Geography here is not evenly distributed, and it's not close. Pebble Beach accounted for 45.8% of total dollar volume across 18 sales. Carmel-by-the-Sea, meaning the village proper, added another 19.7% across 11 sales. Carmel Point contributed 12.4% across 5 sales. Add those three together and you get 77.8%, more than three out of every four dollars that changed hands above $5 million on the Peninsula this year, concentrated in three walkable, well-comped neighborhoods.
Everything else is thinner. Big Sur produced 10.7% of volume, but off just 3 sales, which means it's lumpy rather than liquid: a couple of exceptional properties can swing that whole category. Carmel Valley, Carmel Highlands, Santa Lucia Preserve, and Monterra/Tehama each came in under 4% of total volume, with one or two closings apiece.
The practical read: if you're selling in the core, Pebble Beach, the village, or Carmel Point, you have a deep, active comp set and genuine competitive tension working in your favor. If you're selling outside it, in Carmel Valley or the Preserve or Big Sur, there is no deep pool of buyers sitting there by default. Your marketing has to manufacture the exposure that the core neighborhoods get for free, and your pricing has to be sharper because you don't have five recent comps three doors down to lean on.
How fast this is actually moving
Median days on market across all 44 closings was 31 days. That number is distorted by six sales that closed with essentially zero reported market time, meaning they were arranged before the property was ever genuinely tested in the open market (more on that in a minute). Strip those out and the median jumps to 43 days, with a mean of 107 days.
Look at the distribution and a clearer pattern shows up. 36.4% of these homes sold within 30 days. 34.1% sat on the market for 90 days or more. That's roughly seven out of every ten of this year's $5 million-plus sales landing at one extreme or the other. There isn't much of a middle. Pricing either works, in which case the home moves in weeks, or it doesn't, in which case it sits for a season while the market slowly negotiates the seller down to reality.
That's borne out in the price data too. 22.7% of these sales carried at least one price reduction from the original list price before they finally closed. And on sale-to-list ratio, the median was 97.0%, but 38.6% of closings, nearly four in ten, sold for less than 95 cents on the dollar of the final list price. Only 36.4% closed at or above asking. Pricing discipline is not a nice-to-have in this market right now. It's the difference between a clean sale in under a month and a public, months-long negotiation against yourself.
The part of this market most buyers and sellers never see
Here's the part of the data that I think matters most, and the part almost nobody outside the business ever sees clearly.
Of the 44 closings I analyzed, 6, or 13.6%, never appeared as a genuinely marketed listing before they closed. They show up in MLS as comparable-sale-only entries, meaning the deal was struck and only entered into the system afterward for record-keeping. Another 17 sales, 38.6%, show the identical firm representing both the buyer and the seller. Combined, 52.3%, just over half of every $5 million-plus transaction on the Peninsula this year, involved either no real open-market exposure at all, or a single firm controlling both sides of the negotiation.
I want to be precise about what that means, because it's not a conspiracy and it's not really anyone's fault individually. It's a structural feature of a small, high-trust luxury market. When one firm represents both the buyer and the seller, or when a home is placed with a buyer before it's ever marketed to anyone else, the party who benefits is whichever firm already had the relationship, not necessarily the buyer who would have paid the most if they'd known the home existed. In a market this size, with a handful of teams holding most of the relationships, that pattern isn't an occasional exception. It's just how information and incentive settle when so few players control so much of the flow.
If you're selling, there's a simple, direct question worth asking anyone you're considering hiring: of your last ten closings above $5 million, how many had a different firm representing the buyer than the one representing you? If the honest answer is "most of them stayed in-house," you should understand what you're buying with that convenience. It might be a fast, tidy transaction. It is not the same thing as maximum competitive tension for your price.
If you're buying, the mechanism cuts the other way. If more than half of this year's inventory at this price point never had genuine public exposure, then working with a team that's actually plugged into that flow, and that isn't structurally incentivized to steer you only toward its own pocket listings, is the difference between seeing the real market and seeing a curated slice of it.
What this means if you're selling right now
Price to what's actually closing this month, not to last year's comps or to what a neighbor's Zillow estimate says. Given how bimodal days-on-market is right now, a number that's even modestly aggressive doesn't just cost you a little time. It tends to cost you a full season and a public price cut, both of which show up in the next buyer's negotiating leverage.
Ask for real proof of exposure, not just a sign in the yard and an MLS number. With over half the market's transactions happening off the fully open market this year, "we listed it" and "we actually put it in front of every qualified buyer" are not automatically the same claim, and you're entitled to ask which one you're getting.
What this means if you're buying right now
The long tail on days on market is real negotiating room, but only if someone is actually tracking it for you. A third of this year's $5 million-plus sellers waited 90-plus days and still took a price cut to close. Those sellers exist right now too, and they are not advertising their fatigue.
At the same time, be ready to move on anything priced correctly the day it hits the market, because more than a third of this year's inventory cleared inside 30 days with real competition. And ask whoever is representing you directly how much of the current off-market inventory they can actually show you, versus how much only exists inside one firm's own client list.
Where we come down on this
This is the lens we bring to every listing and every buyer search we take on at Truszkowski Freedman & Associates. We operate under Engel & Völkers, a global network with real reach well beyond the Peninsula, but the way we work locally is built around a much older idea: we represent one side of the table, and we tell clients what the data actually supports, even when it isn't the number they were hoping to hear. Global reach paired with a strict, unglamorous commitment to fiduciary duty is rarer in this market than it should be, and it's the whole reason we built the analysis in this piece in the first place. Straight information is the actual product.
Methodology
All figures in this analysis come from closed residential transactions recorded in MLSListings for Monterey County, filtered to sales of $5,000,000 or more that closed between January 1 and July 29, 2026. Figures will shift as more of the year closes out. We plan to update this analysis quarterly.
Frequently asked questions
How many homes sold for $5 million or more on the Monterey Peninsula in 2026?
Forty-four homes closed at $5 million or above on the Monterey Peninsula between January 1 and July 29, 2026, for a combined $451.7 million in sales volume, based on closed transactions recorded in MLSListings.
What is the median price of a luxury home sale on the Monterey Peninsula?
The median closed price among $5 million-plus sales in 2026 was $7.19 million. The mean was higher, at $10.3 million, pulled upward by a small number of sales above $20 million.
Where is most of the Peninsula's luxury real estate volume concentrated?
Pebble Beach, Carmel-by-the-Sea, and Carmel Point together accounted for 77.8% of all $5 million-plus sales volume in 2026. Pebble Beach alone represented 45.8% of the total.
Are $5 million-plus homes on the Monterey Peninsula selling above or below asking price?
Most are selling slightly below list. The median sale-to-list ratio in 2026 was 97.0%. Only 36.4% of sales closed at or above the final asking price, while 38.6% closed below 95% of list.
How long does it take to sell a $5 million-plus home on the Monterey Peninsula?
It depends heavily on pricing. Median days on market was 31 days across all sales, though that figure includes pre-arranged deals with no real market exposure. Excluding those, the median rises to 43 days. The distribution is bimodal: 36.4% of homes sold within 30 days, while 34.1% sat on the market for 90 days or more.
What percentage of luxury Monterey Peninsula listings sell off-market?
Roughly 13.6% of 2026's $5 million-plus closings never appeared as a genuinely marketed open listing before closing. When you include sales where the same firm represented both the buyer and seller, that figure rises to 52.3%, meaning just over half of this year's transactions had limited or no true open-market price discovery.
Is now a good time to buy a luxury home on the Monterey Peninsula?
For buyers willing to do the work, yes. A third of this year's sellers sat on the market 90-plus days and still took a price reduction before closing, which is genuine negotiating leverage. The tradeoff is that well-priced new listings are moving fast, so buyers need representation that can act quickly and that has visibility into off-market inventory, not just what's publicly listed.
Is now a good time to sell a luxury home on the Monterey Peninsula?
Yes, if you price to the current data rather than to last year's comps. Correctly priced homes are clearing in under a month with real competition. Overpriced homes are not floating gently back to value, they're sitting for a season and then taking a public price cut, which is a worse outcome than pricing accurately from day one.