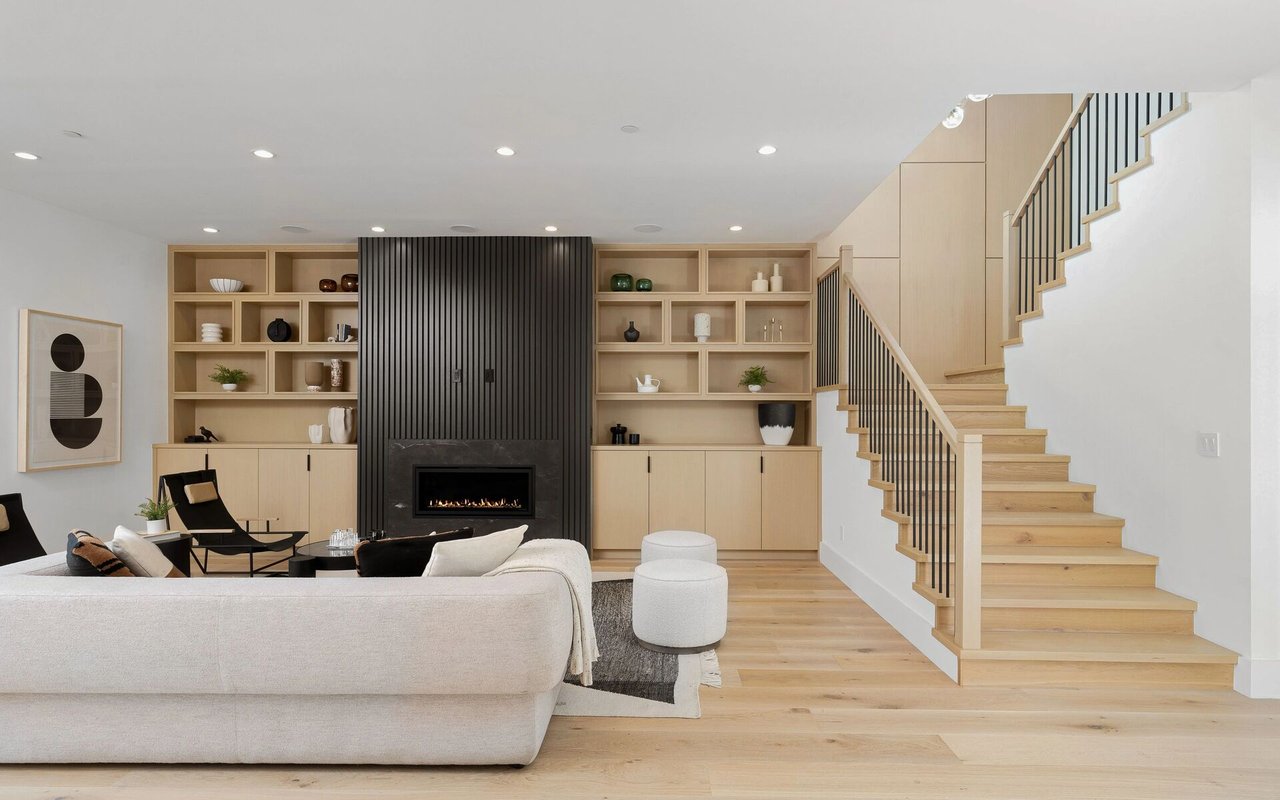
Modern living room with a slatted fireplace wall, built-in shelves, and a pale-wood staircase.

Annual Luxury Real Estate Market Report 2022

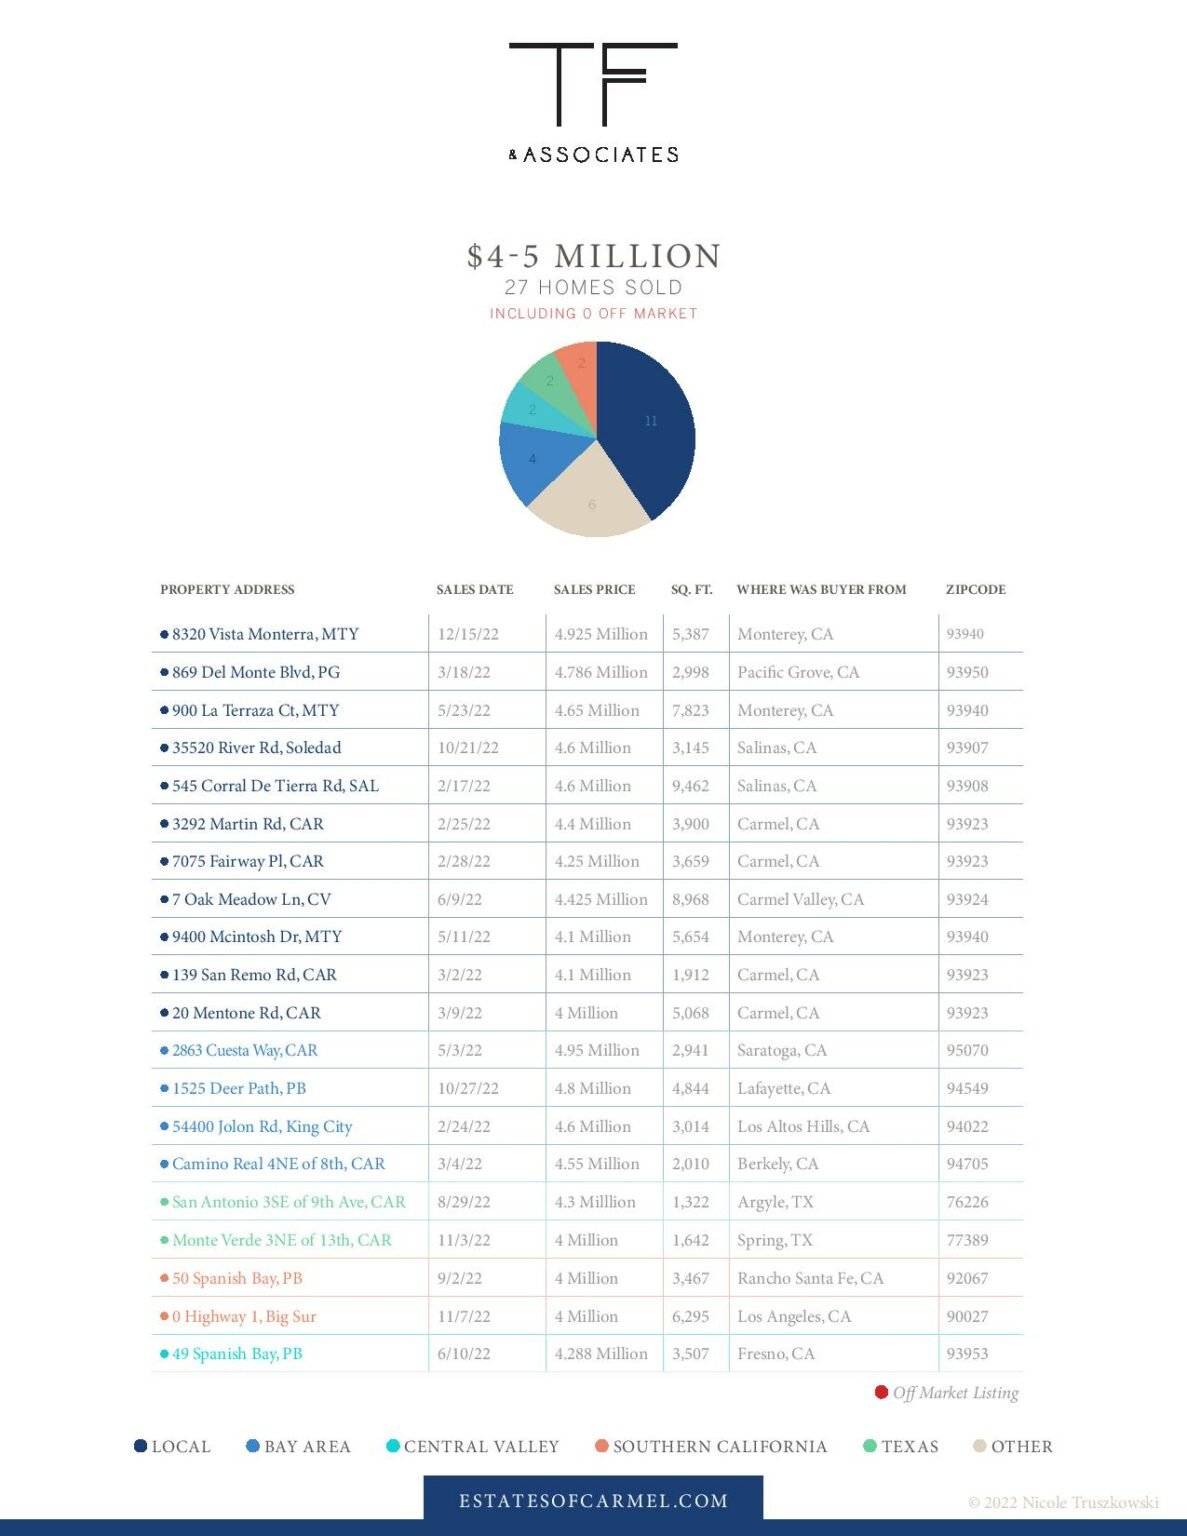
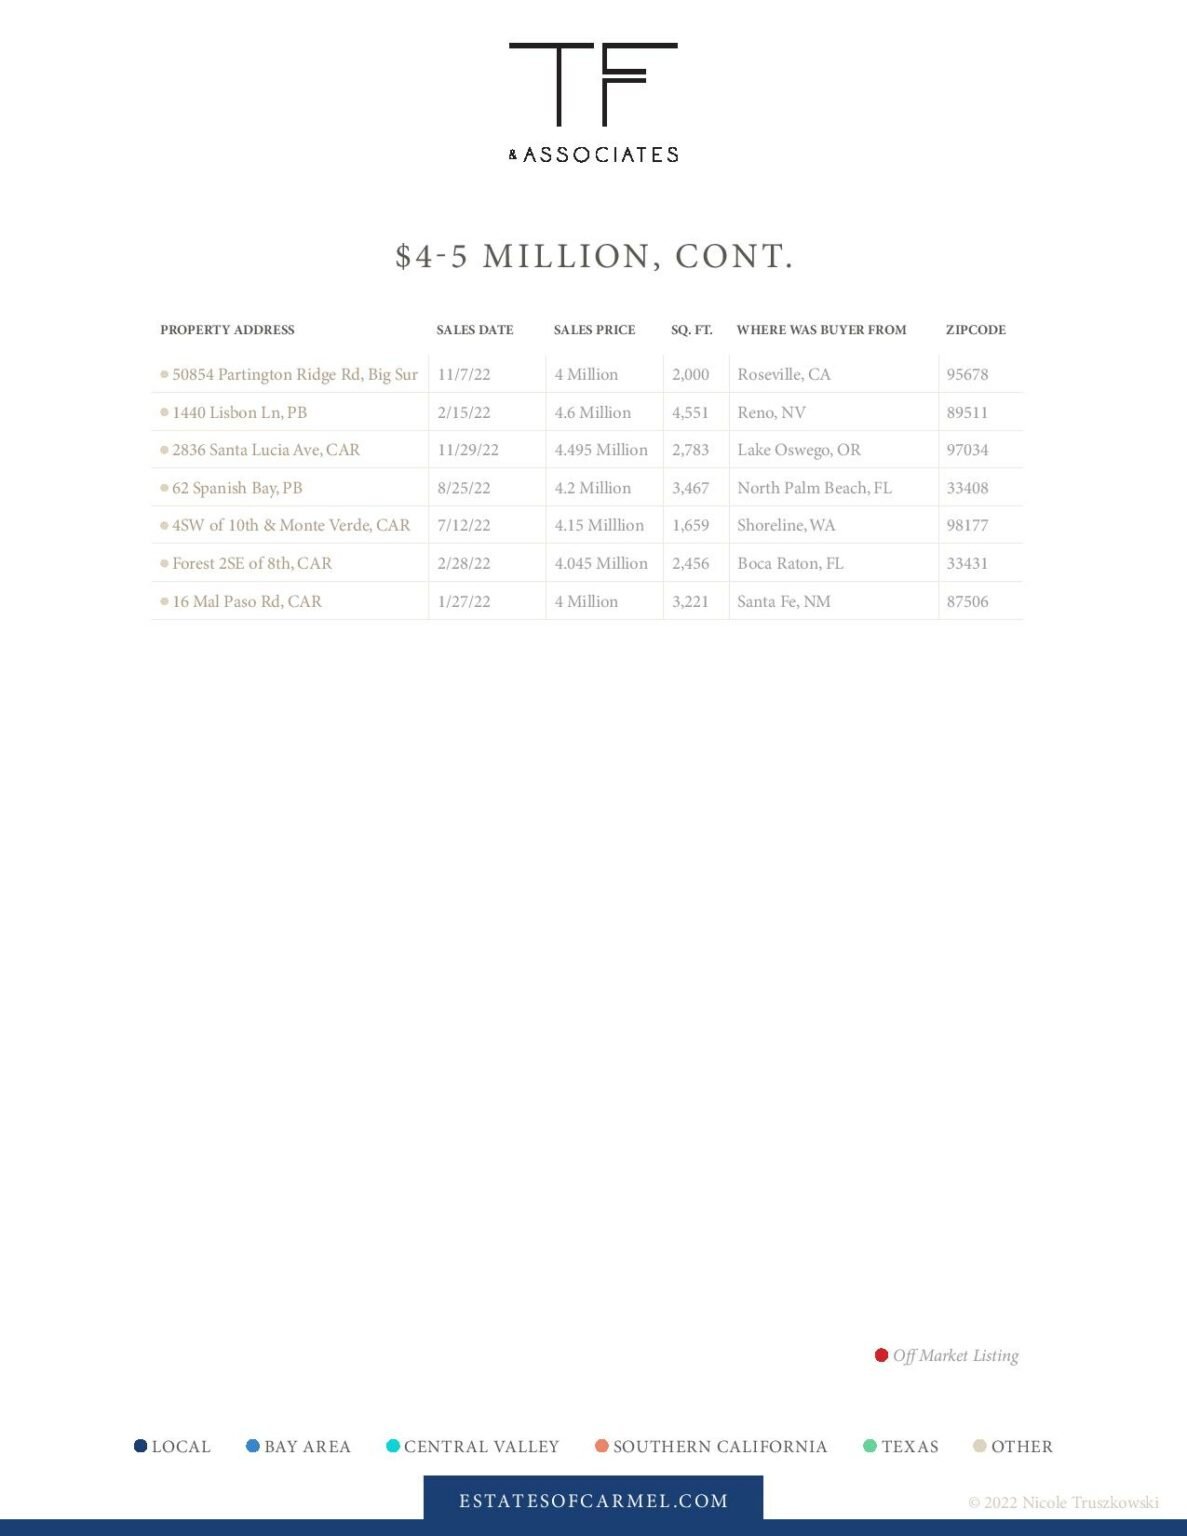
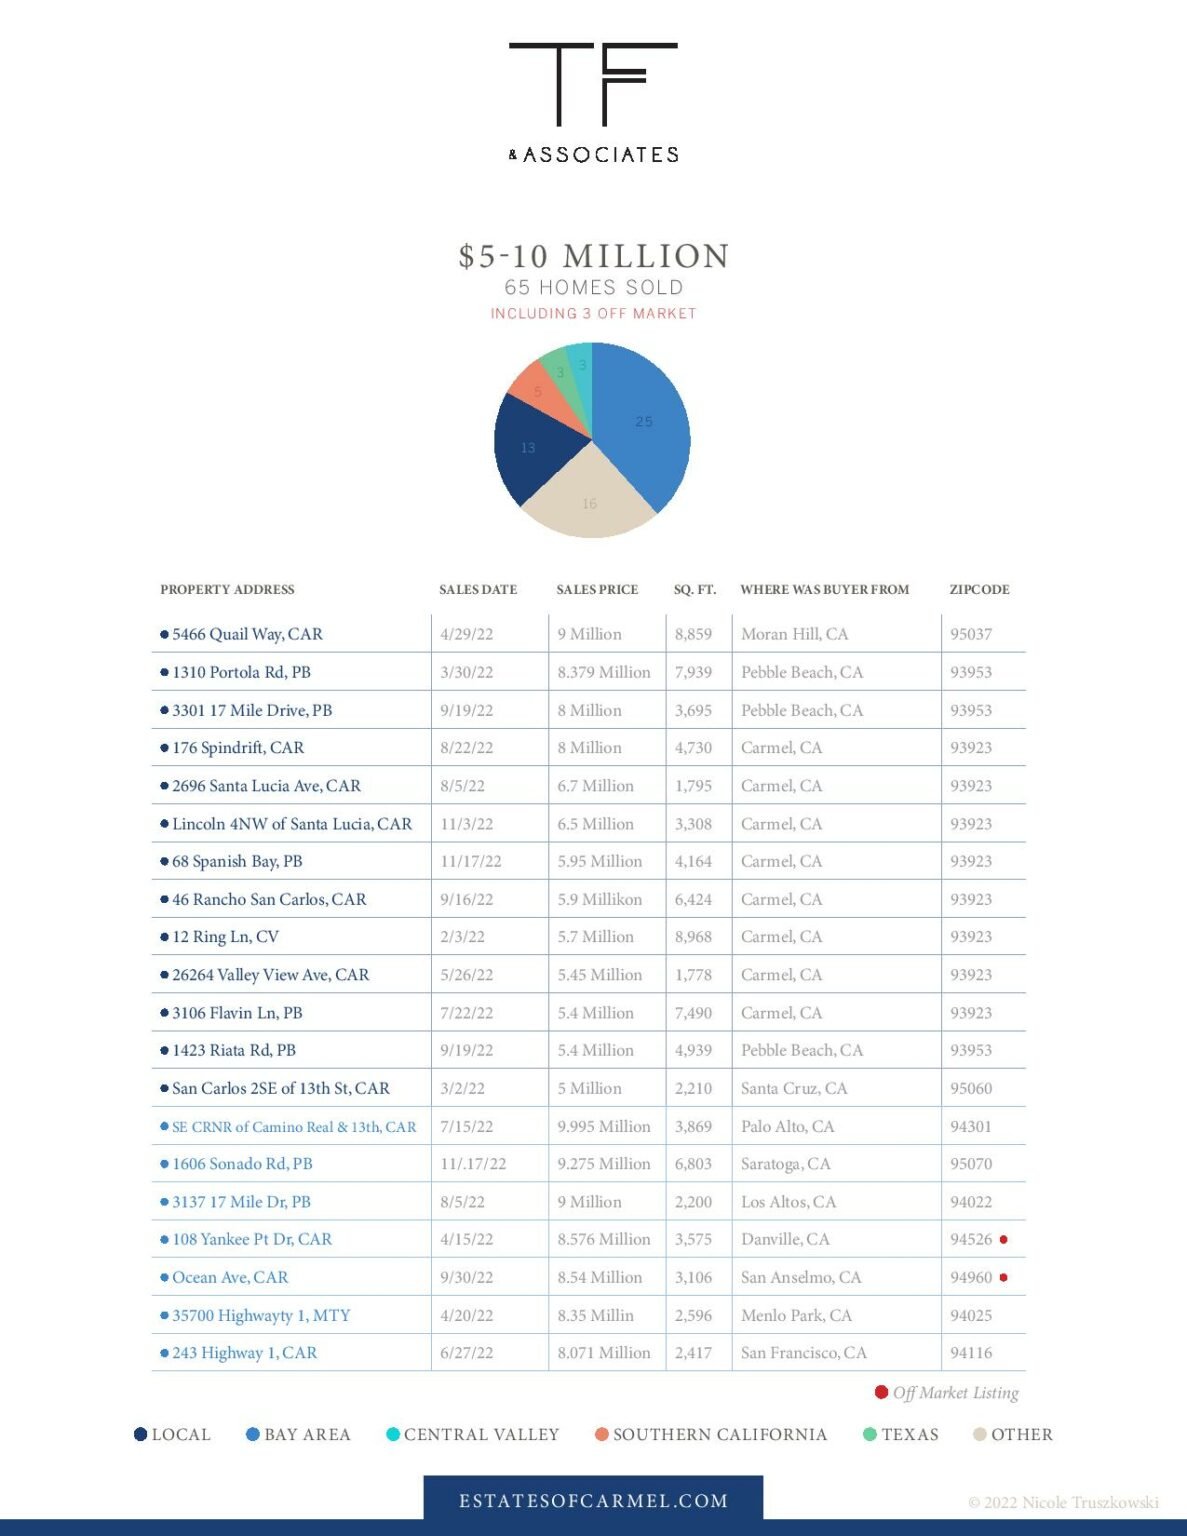
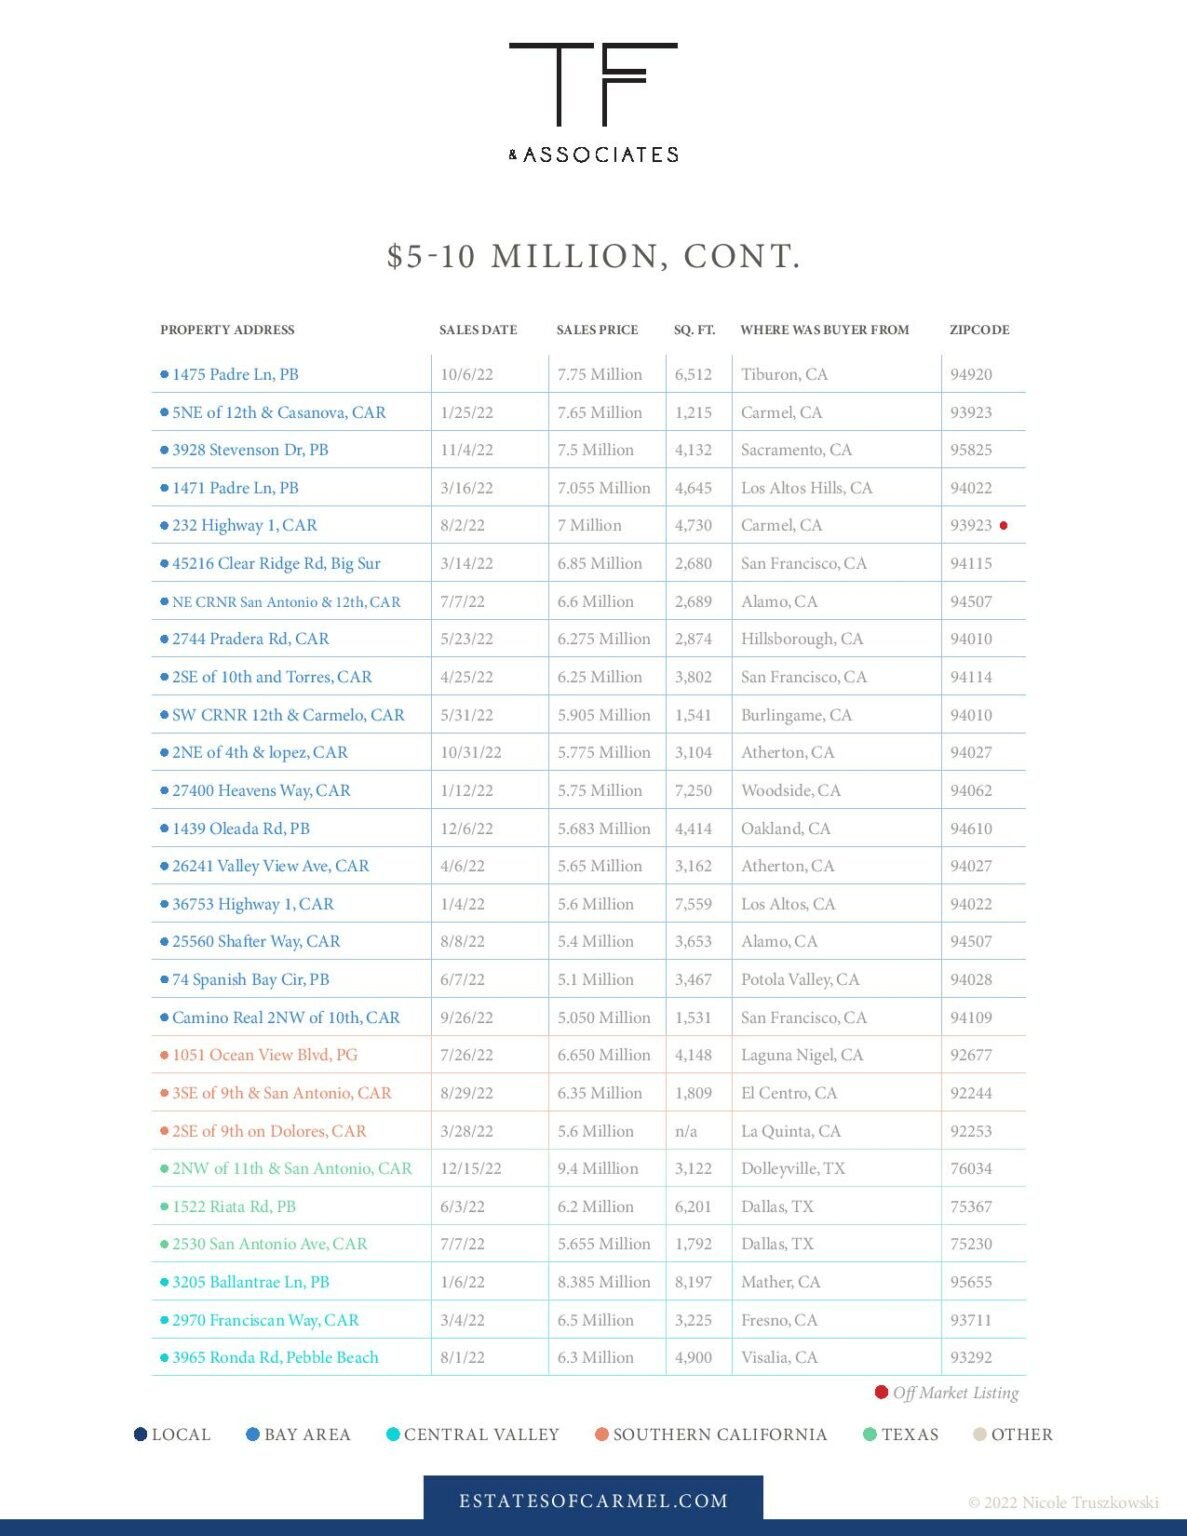
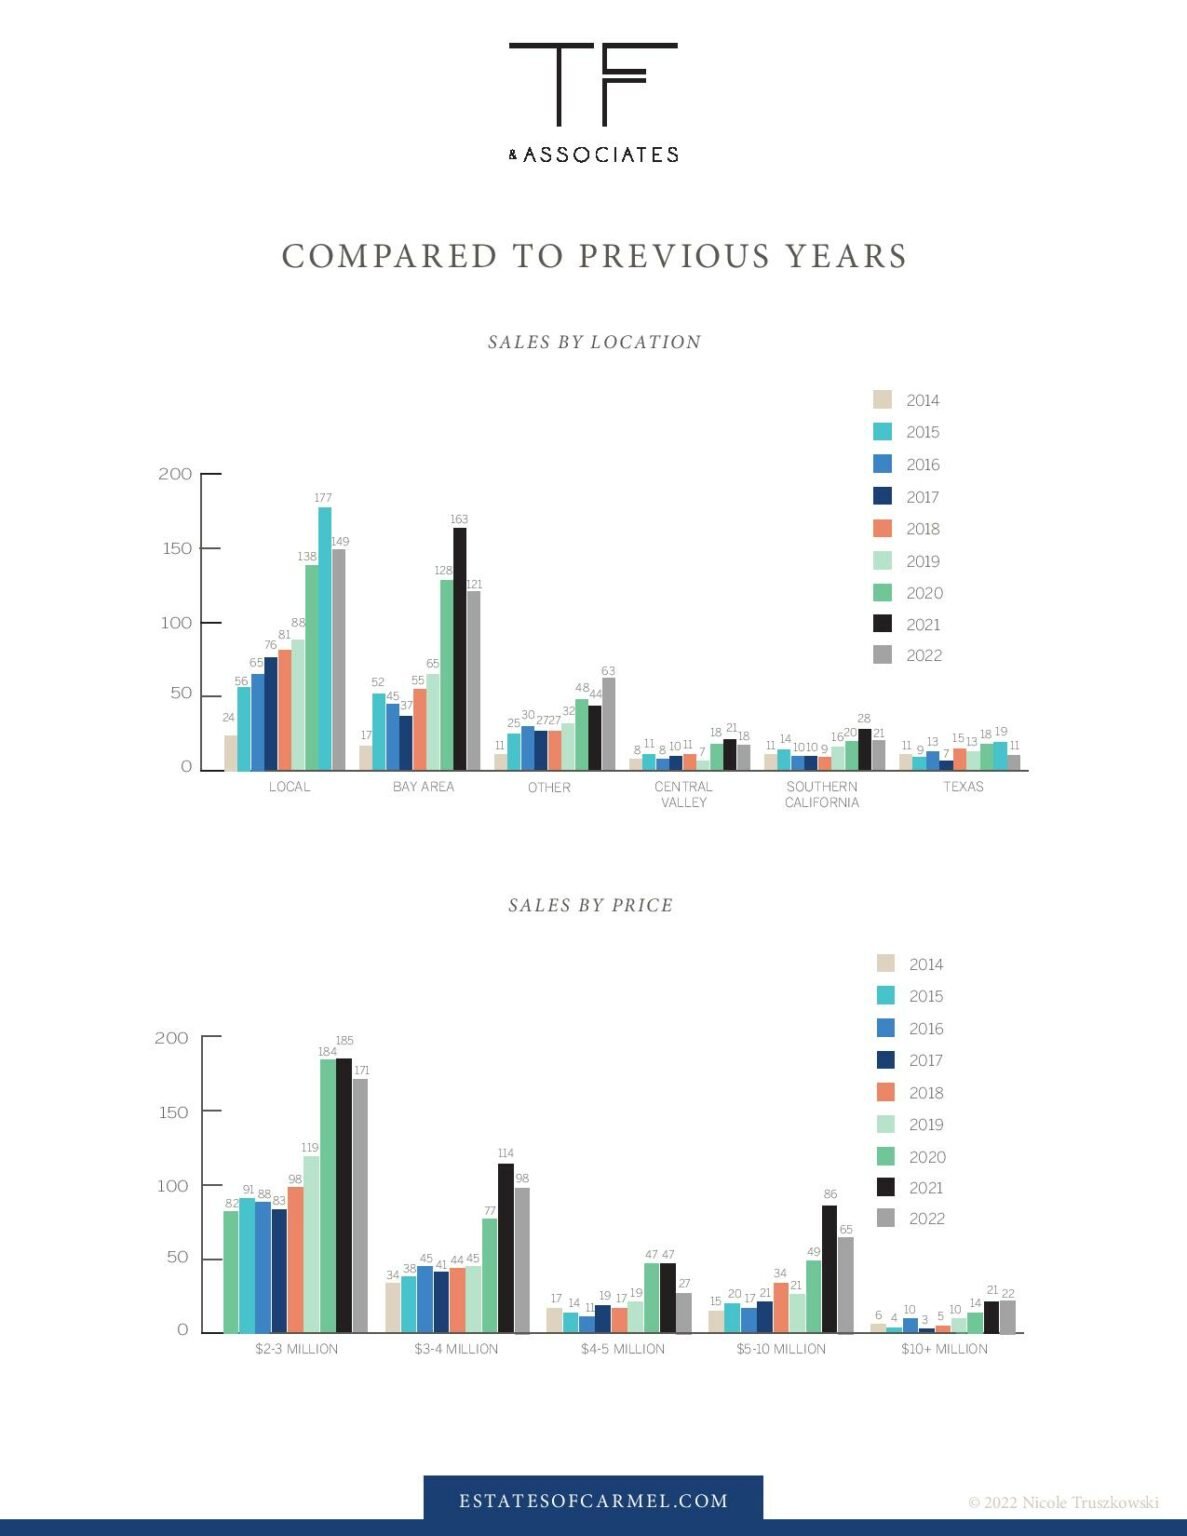
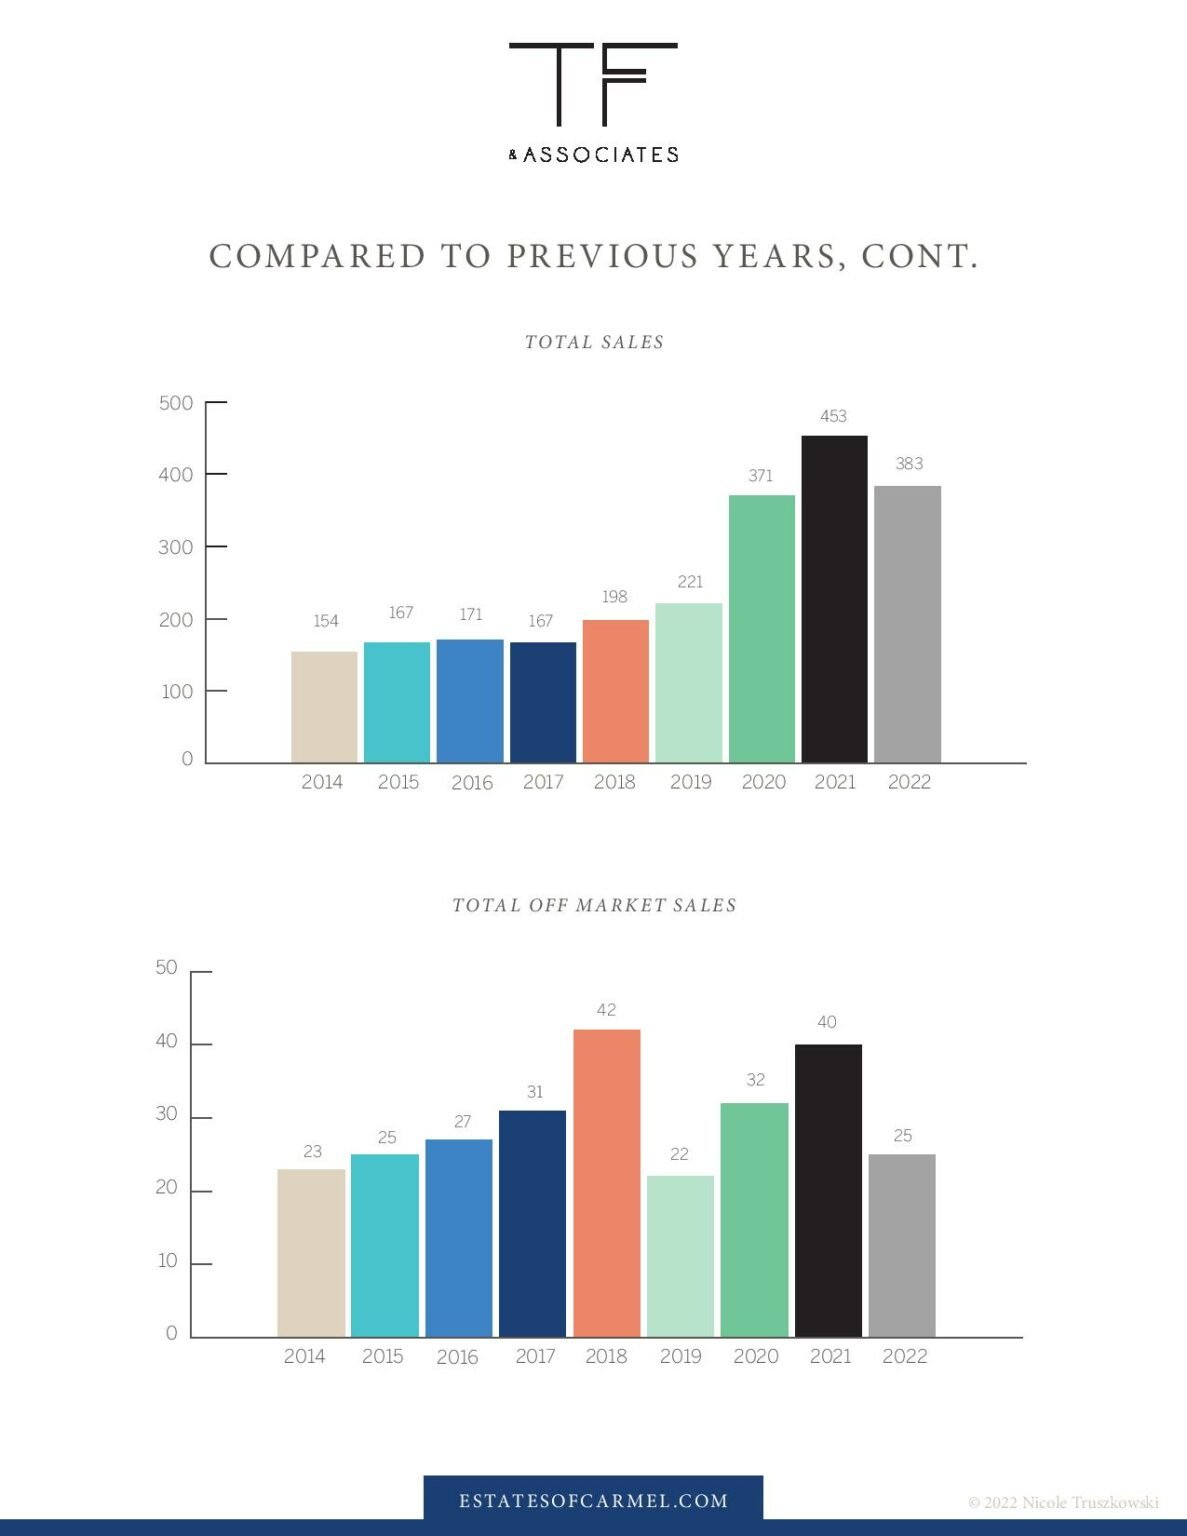
No other team on the Monterey Peninsula has produced a report quite like this! Any agent can tell you the price of homes sold in your neighborhood. However, most agents have no clue where the buyers are coming from. This report showcases 10 years of sales, the cities where buyers are coming from and what they paid. In 2022 there were 383 homes that sold over 2 million; sales were down 15.5% from the pandemic peak of 453 sales in 2020. The real estate market has recalibrated to the 2019 pre-COVID sales numbers.
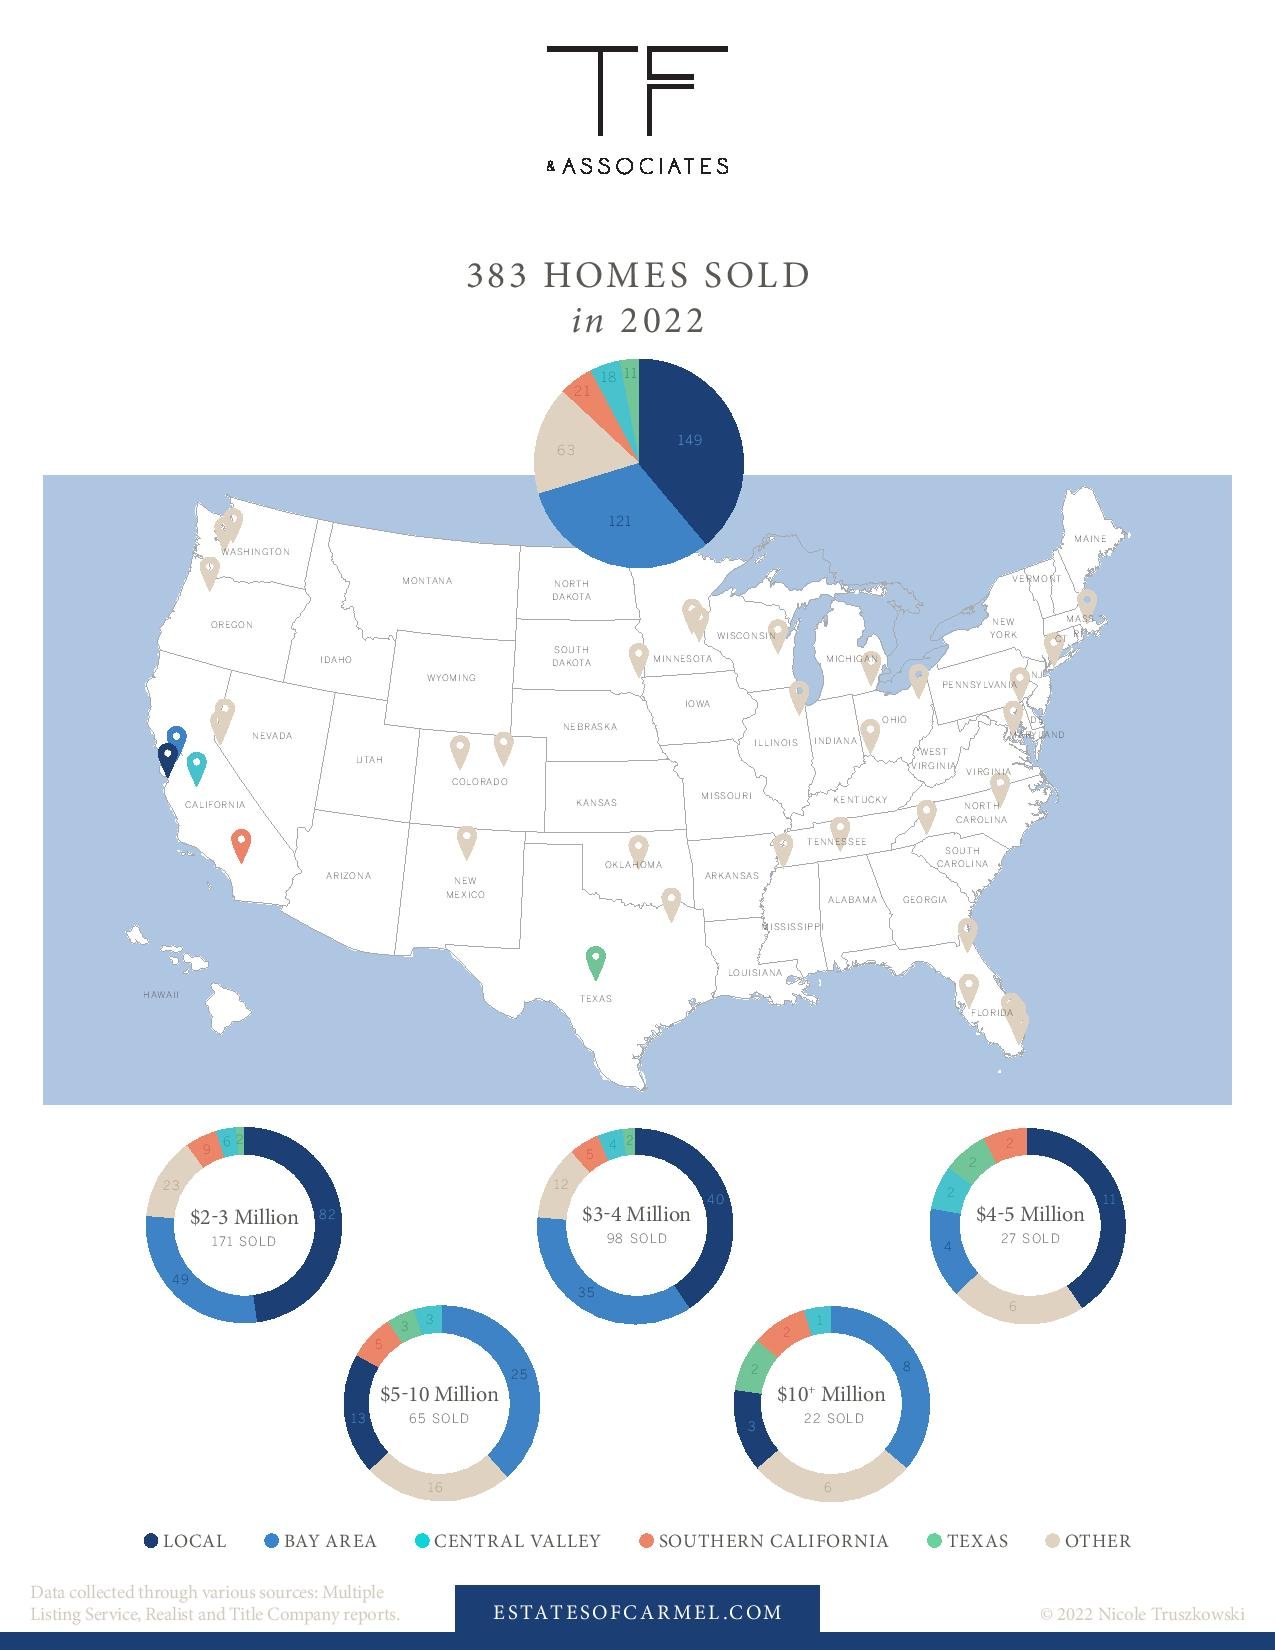
 
2022 home sales infographic with a U.S. map and charts showing sales by price range and region.
 
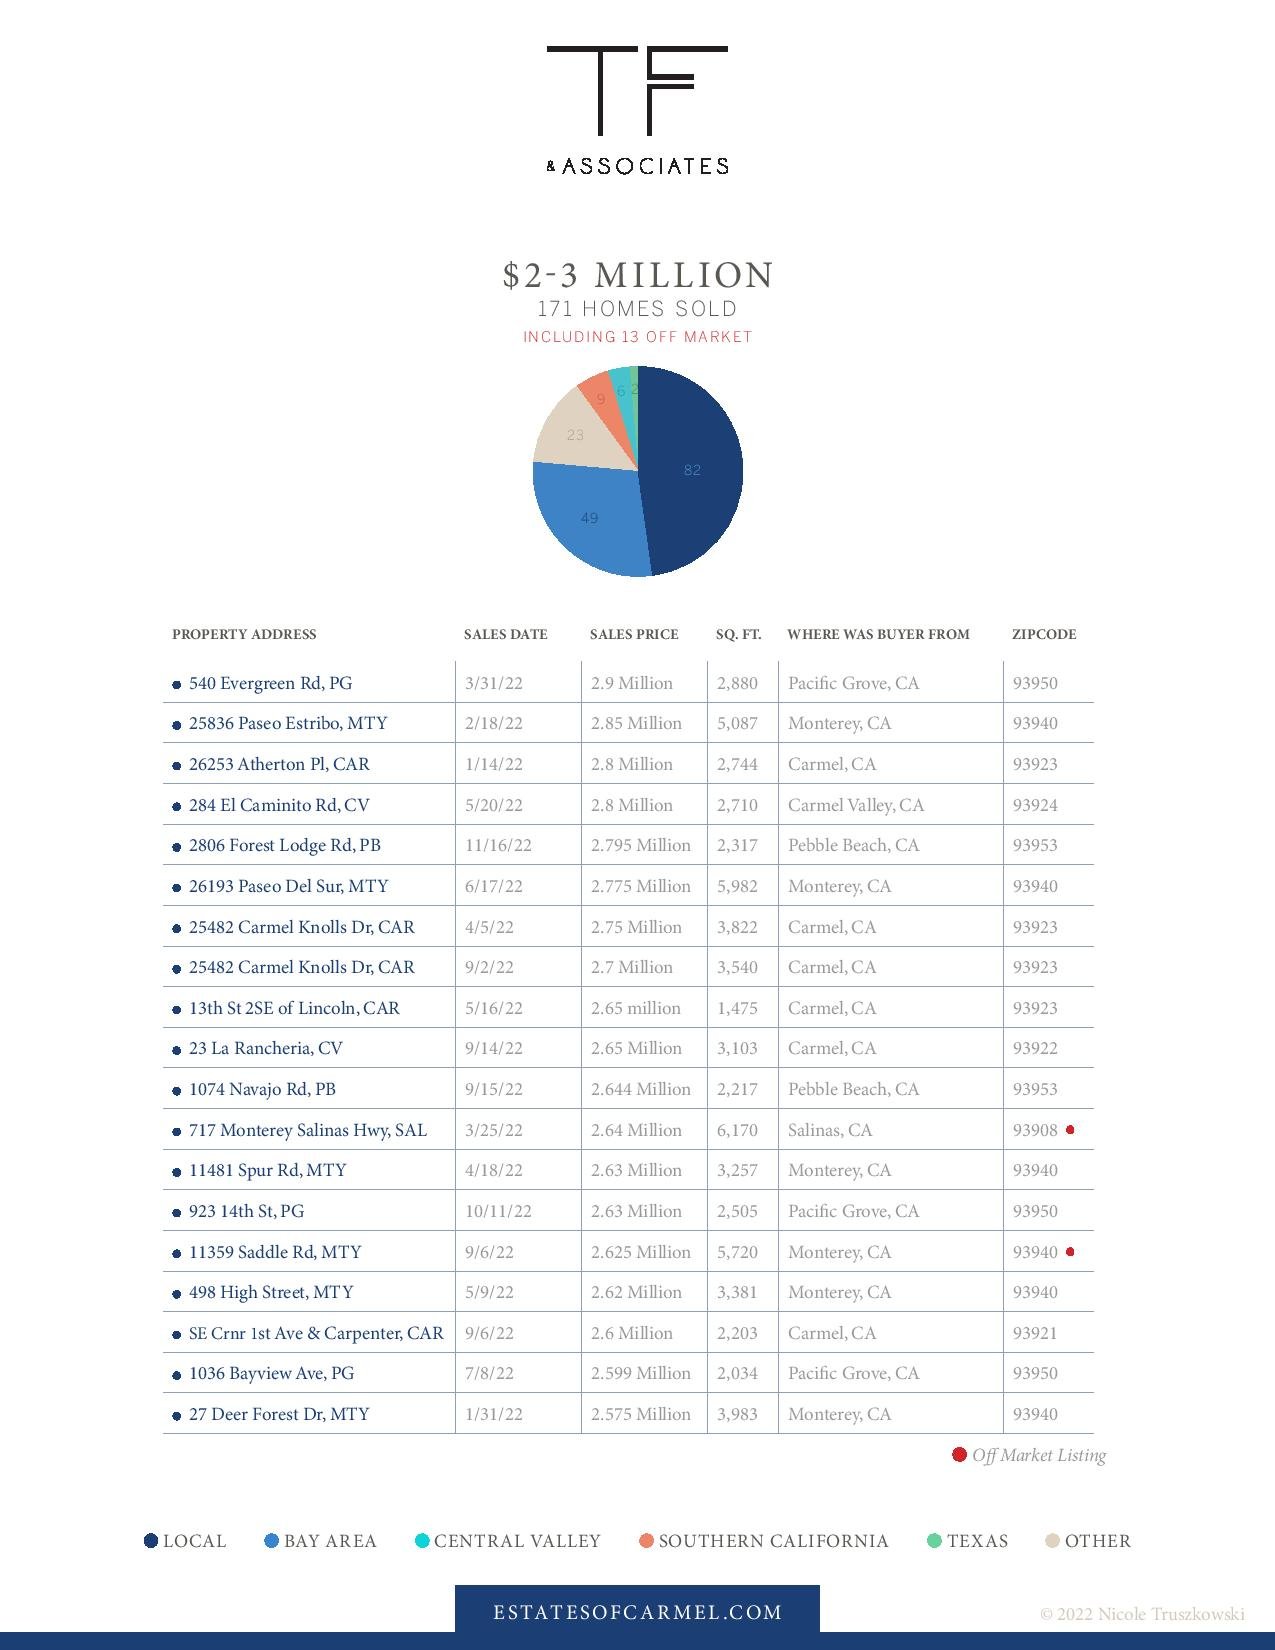
Chart and table summarizing 171 luxury home sales priced $2–3 million, including buyer origins and off-market listings.
 
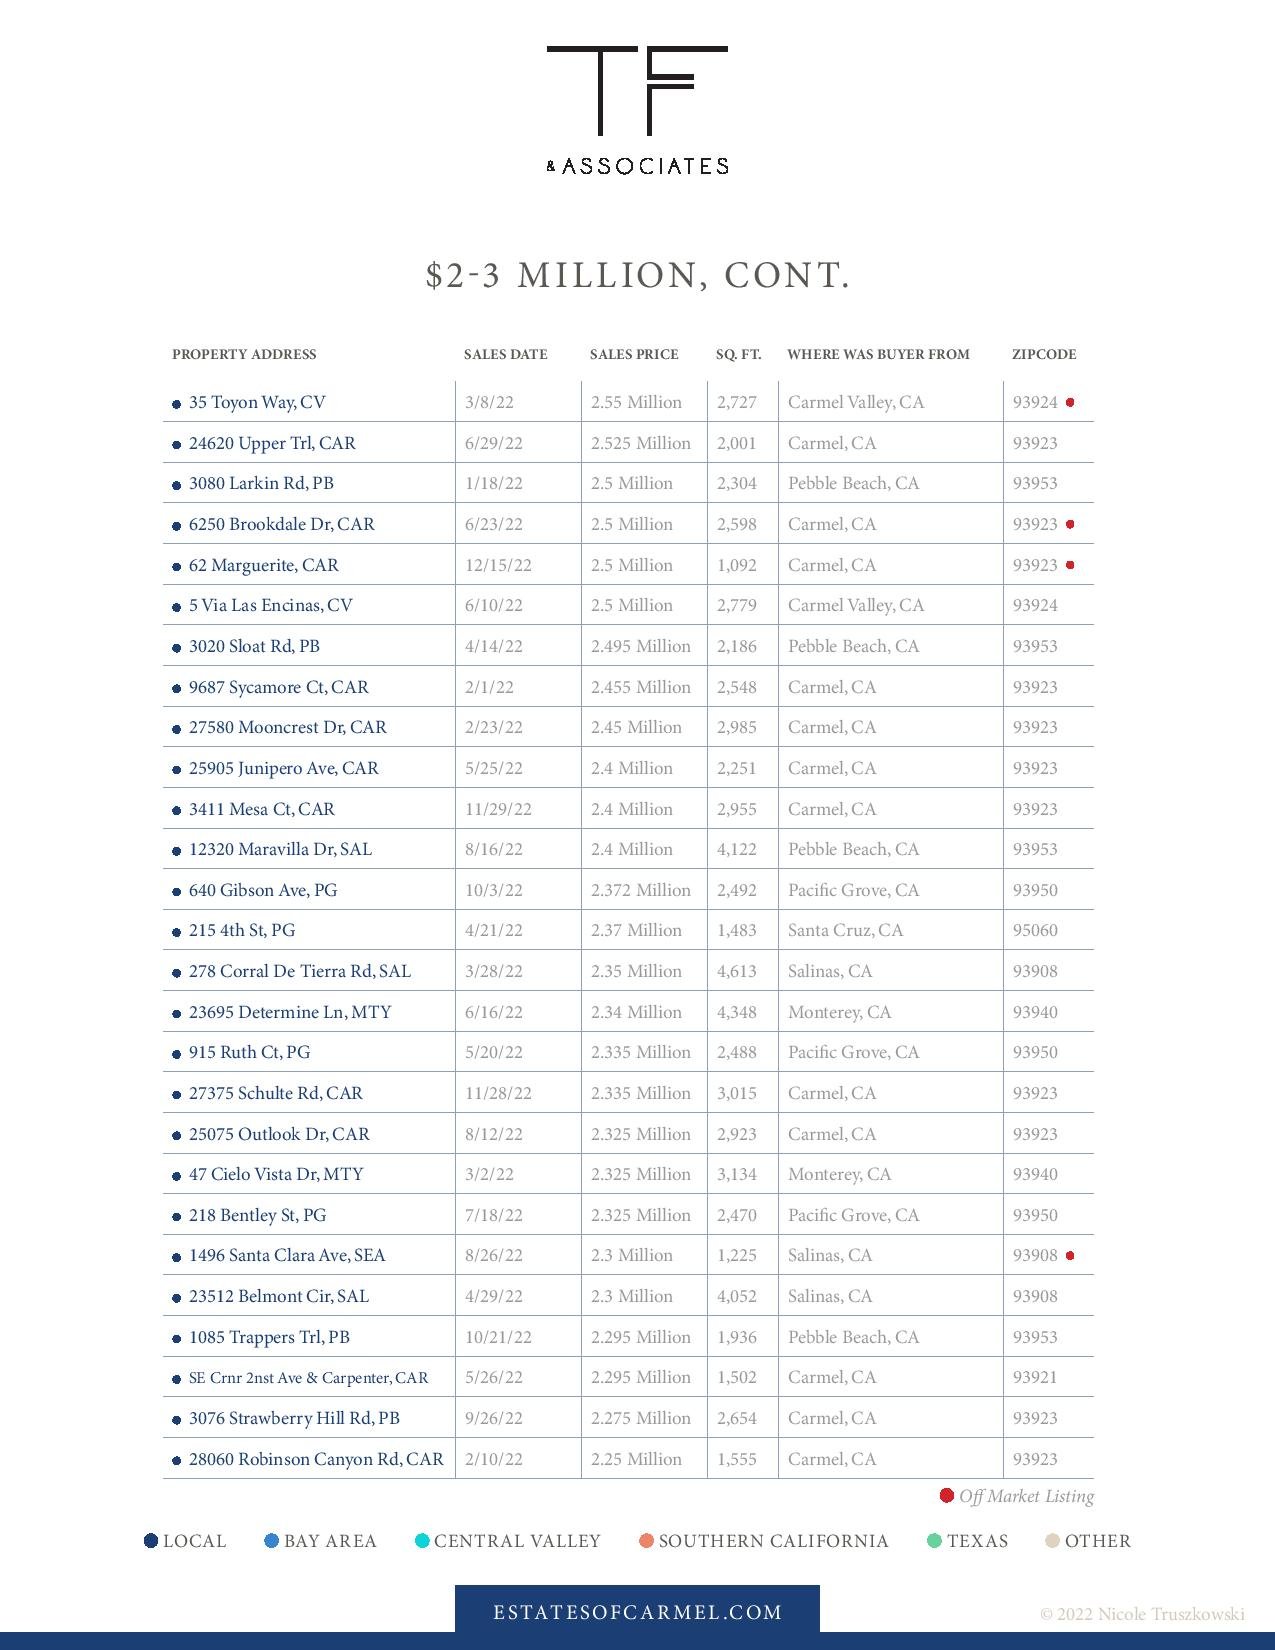
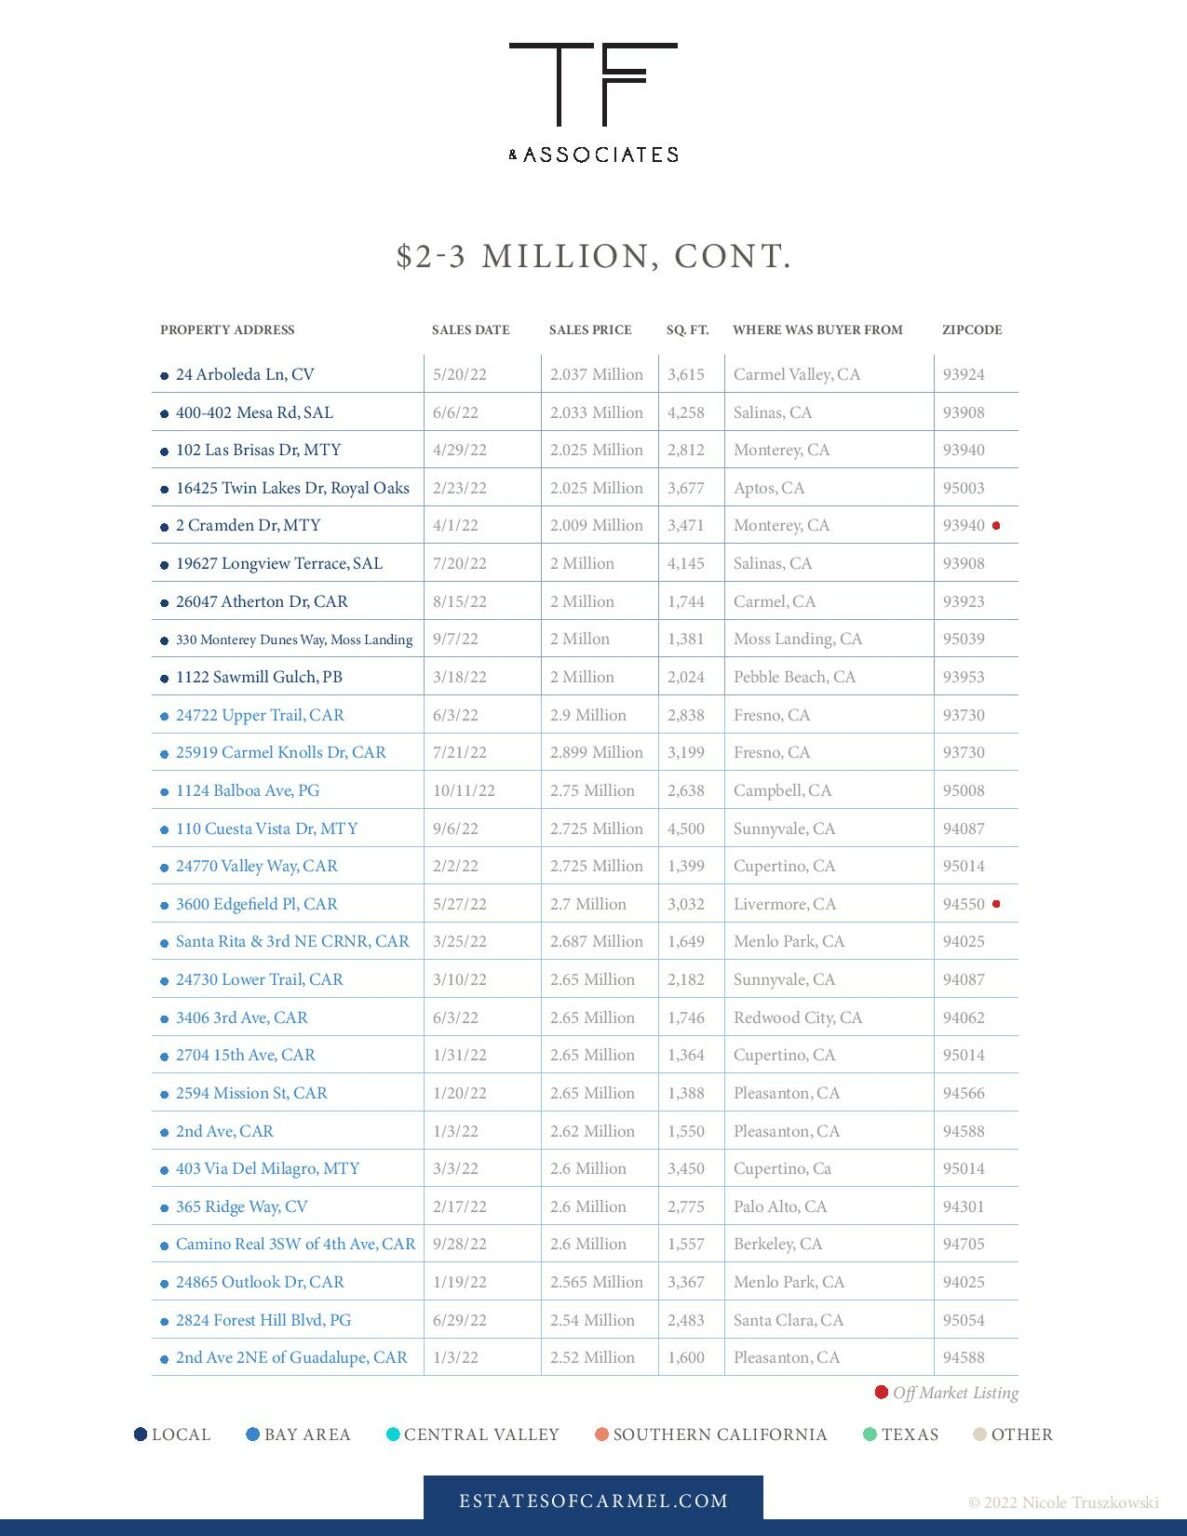
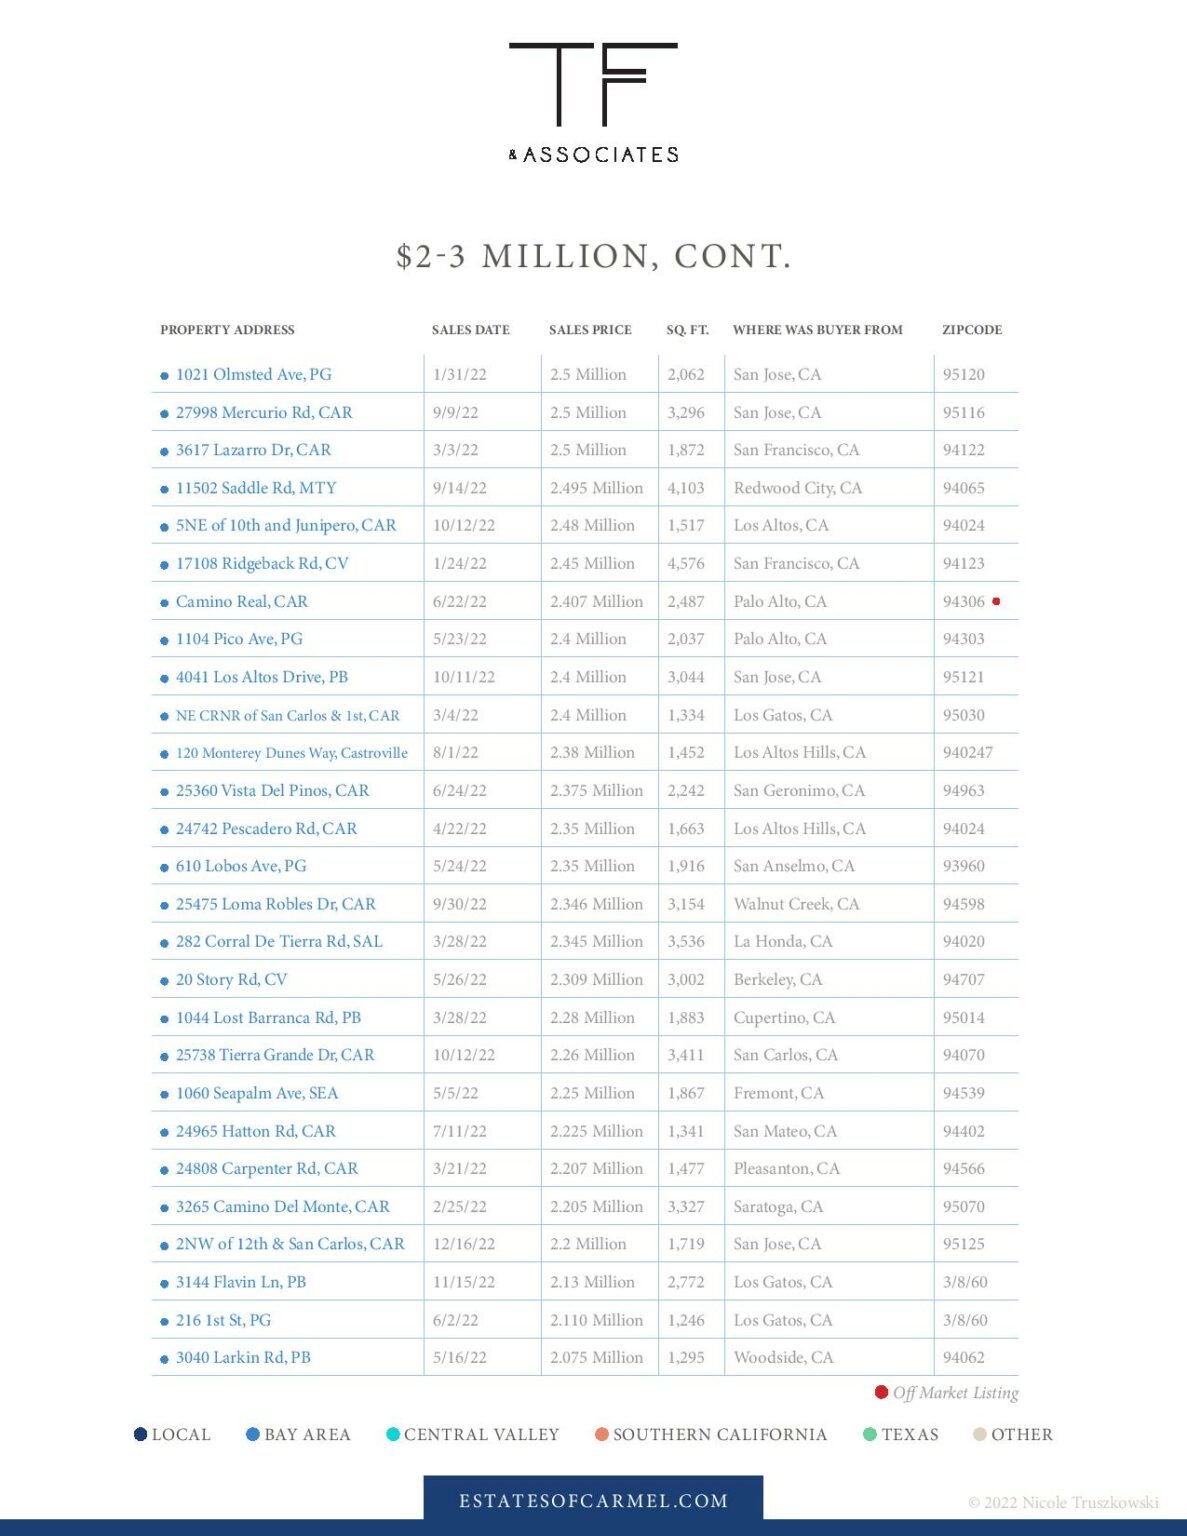
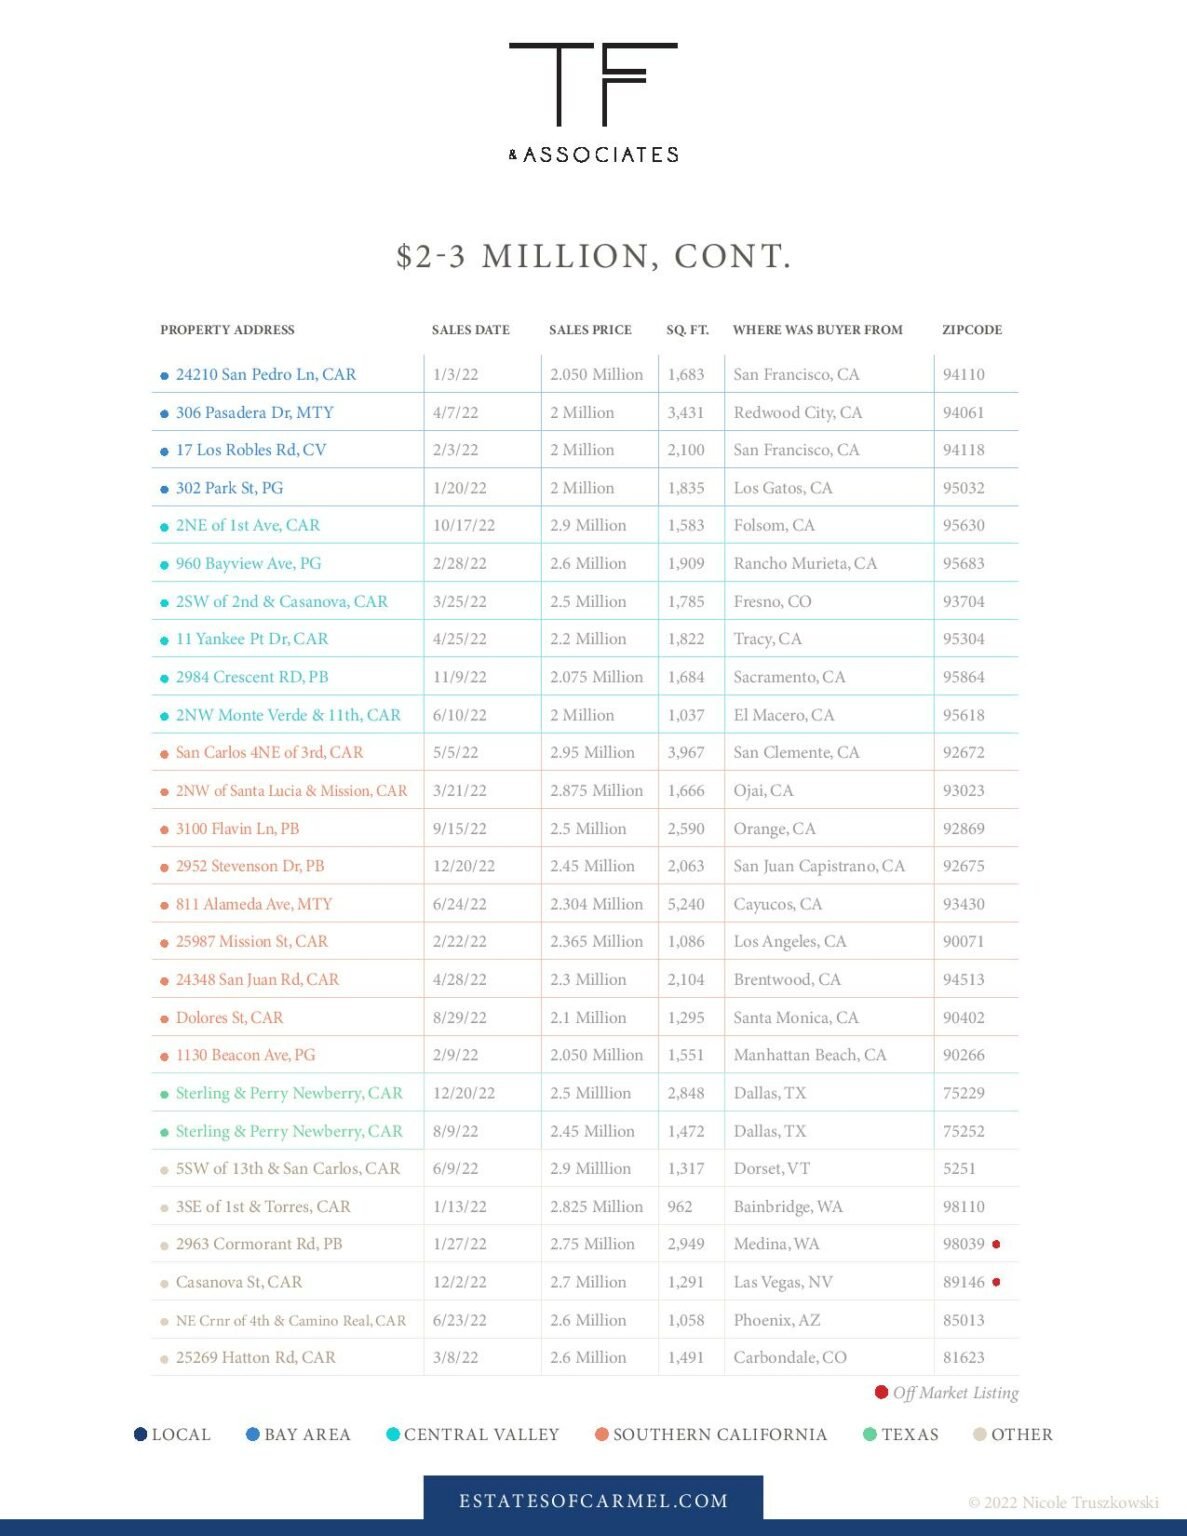
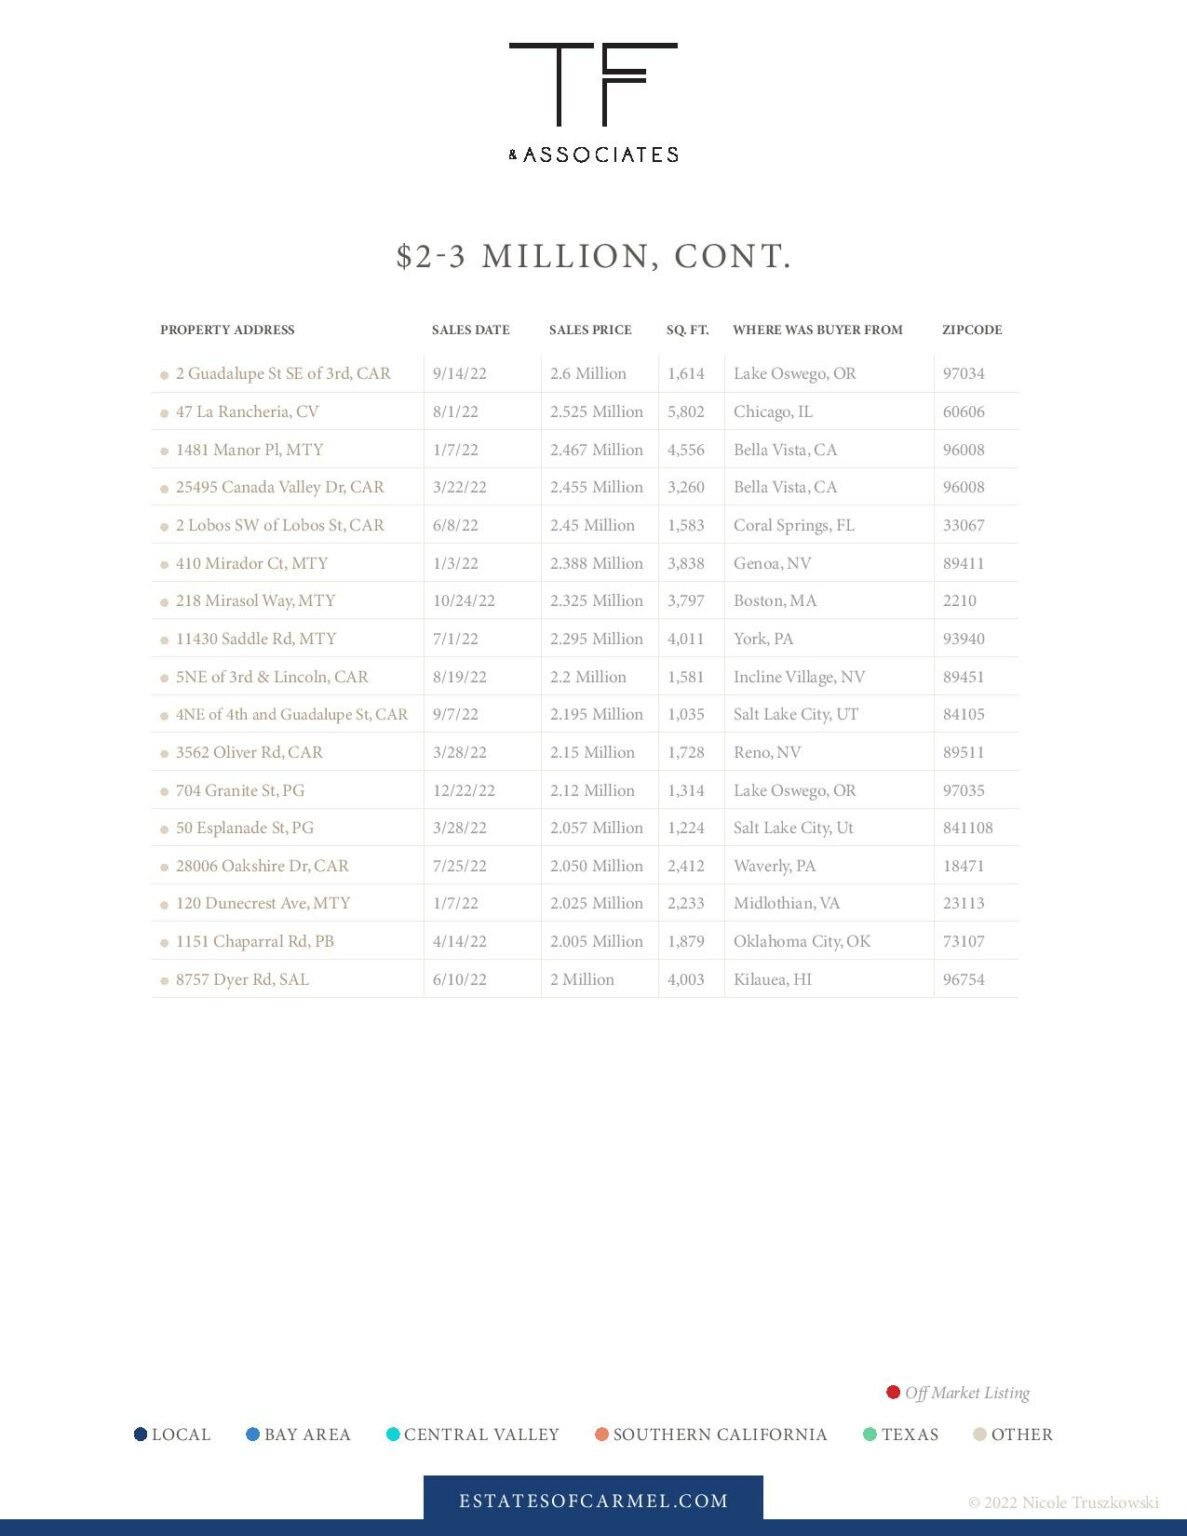
Table of 2022 property sales priced from $2 million to $3 million, with sale details and buyer locations.
 
2022 luxury real estate sales table for properties priced between $2 million and $3 million.
 
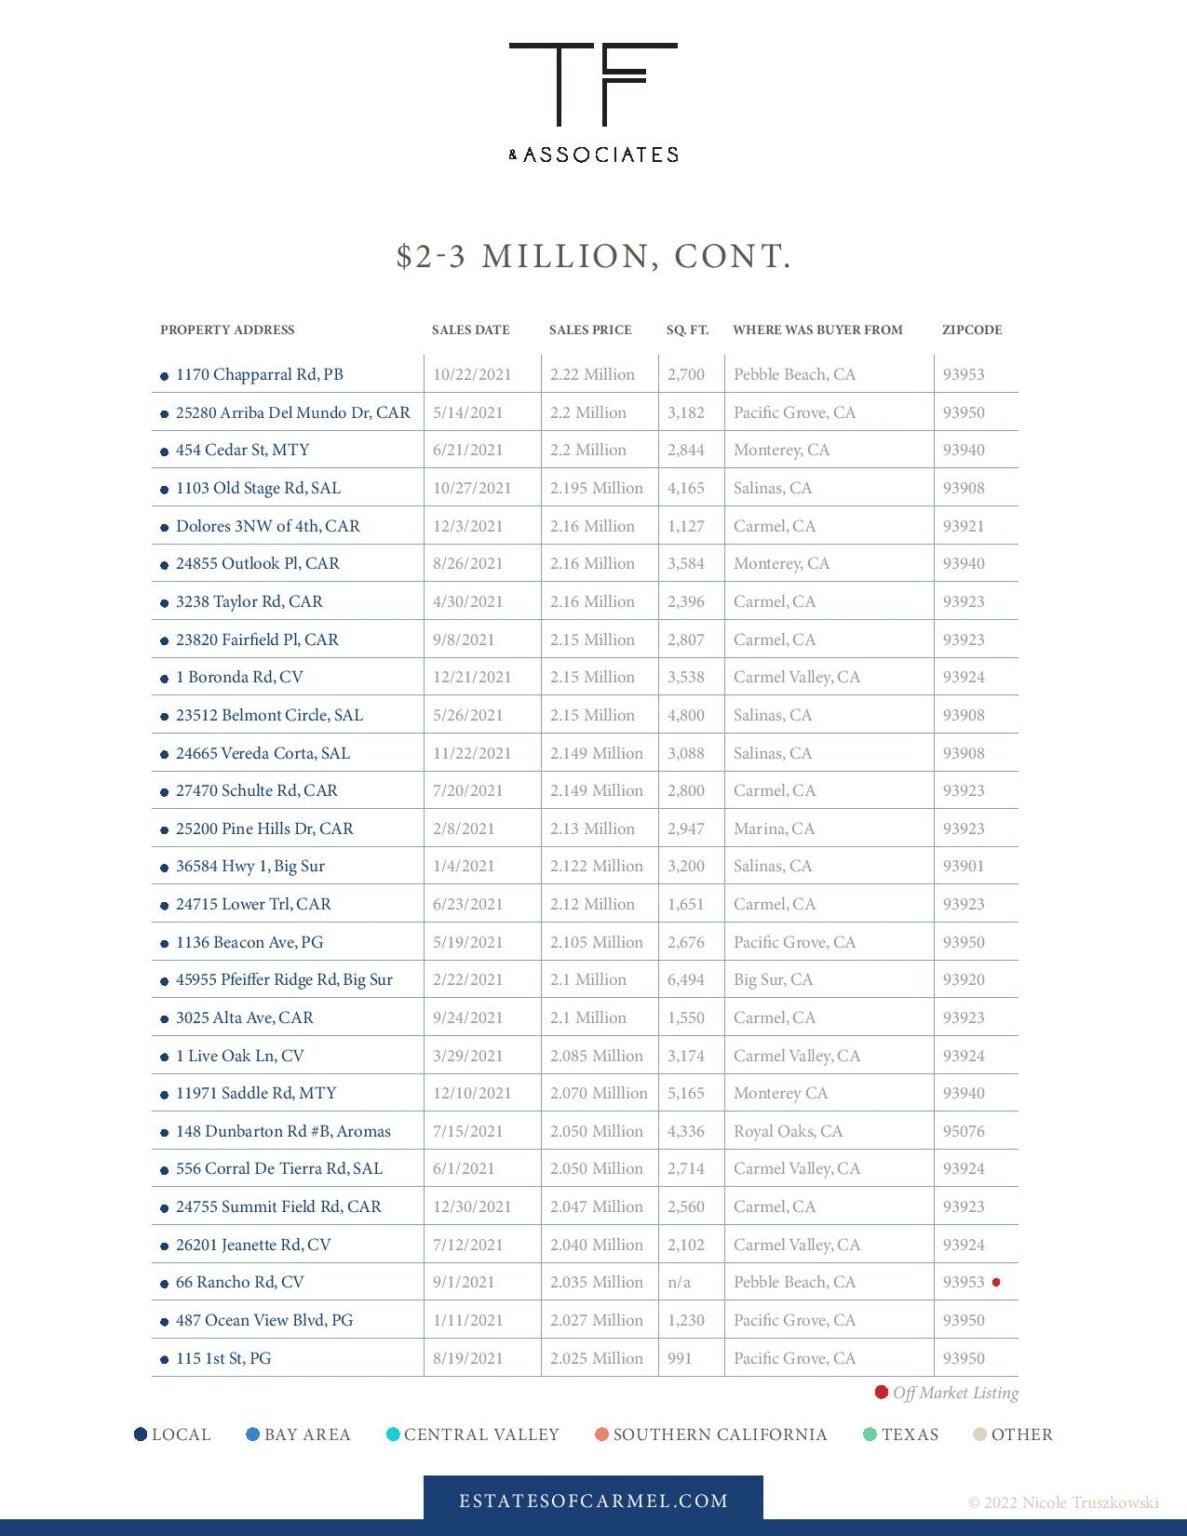
Table of 2021 luxury home sales priced between $2 million and $3 million, with addresses, prices, and buyer locations.
 
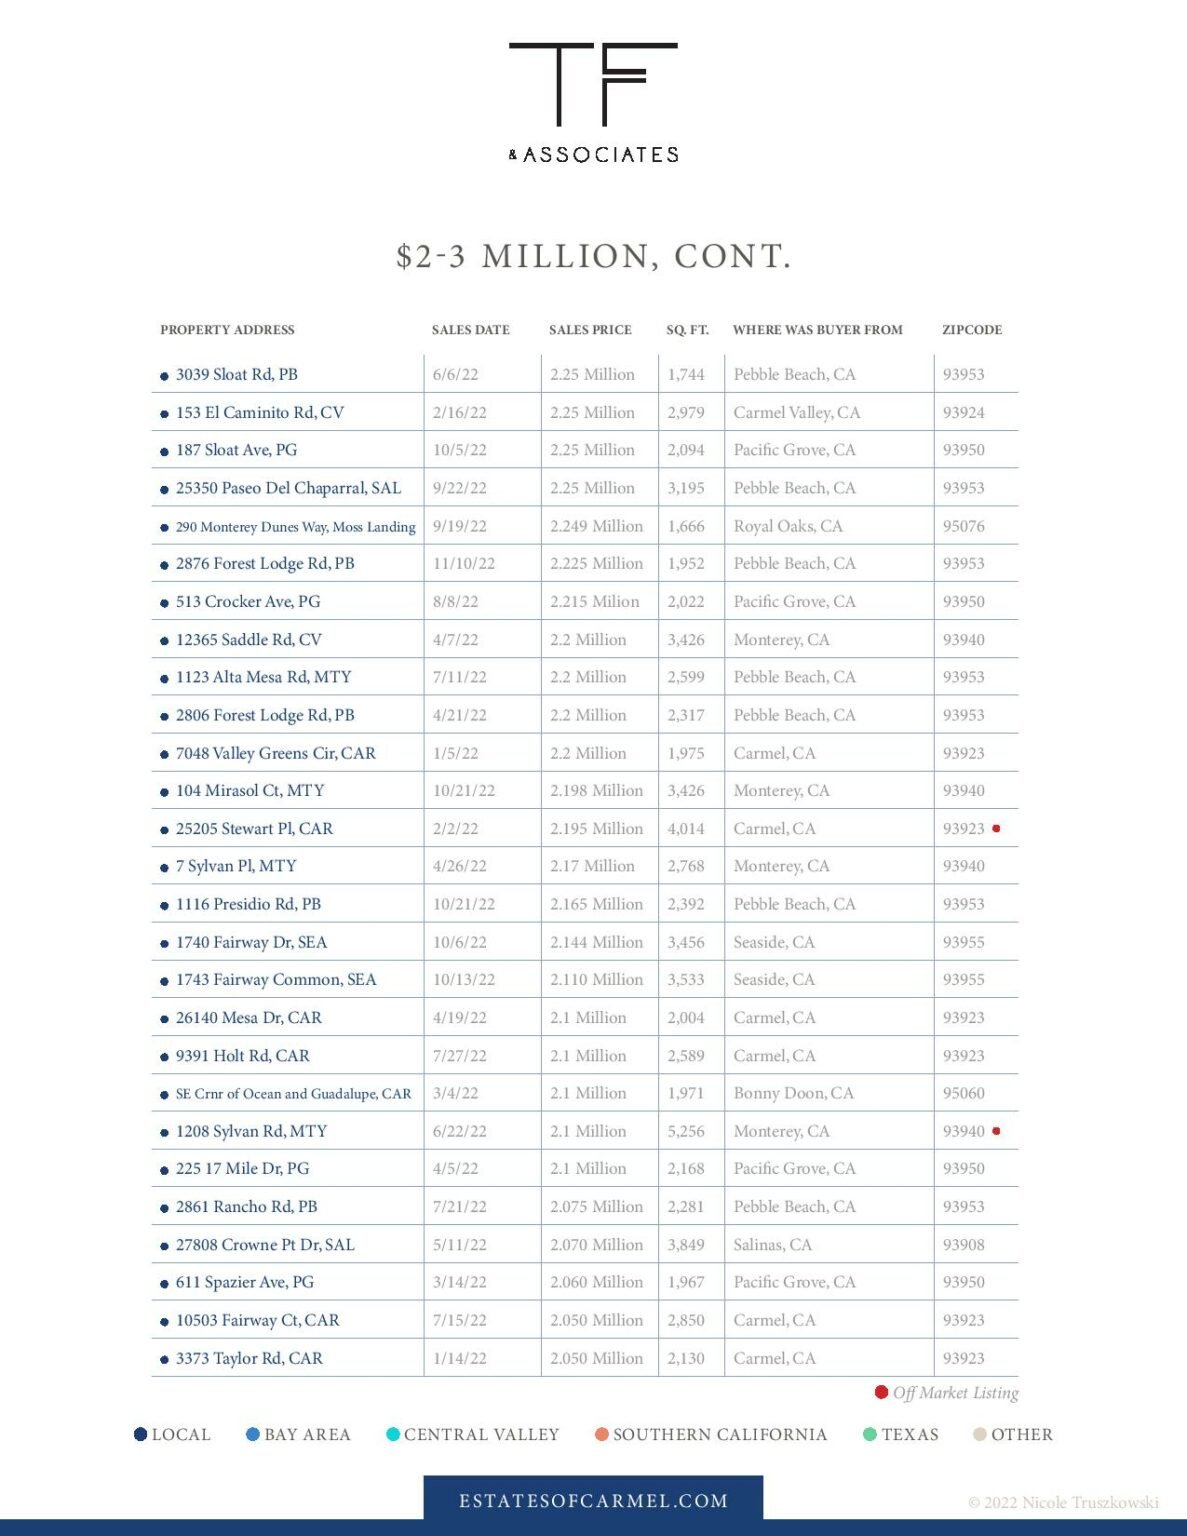
Table of 2022 luxury home sales priced around $2–3 million, with buyer locations and regional color key.
 
2022 luxury real estate report table listing $2–3 million property sales, buyer locations, and regional categories.
 
Color-coded table of 2022 real estate sales priced between $2 million and $3 million.
 
Luxury real estate report table listing $2–3 million sales, buyer origins, square footage, and ZIP codes.
 
2022 luxury home sales infographic with buyer-origin pie chart and a table of property sales.
 
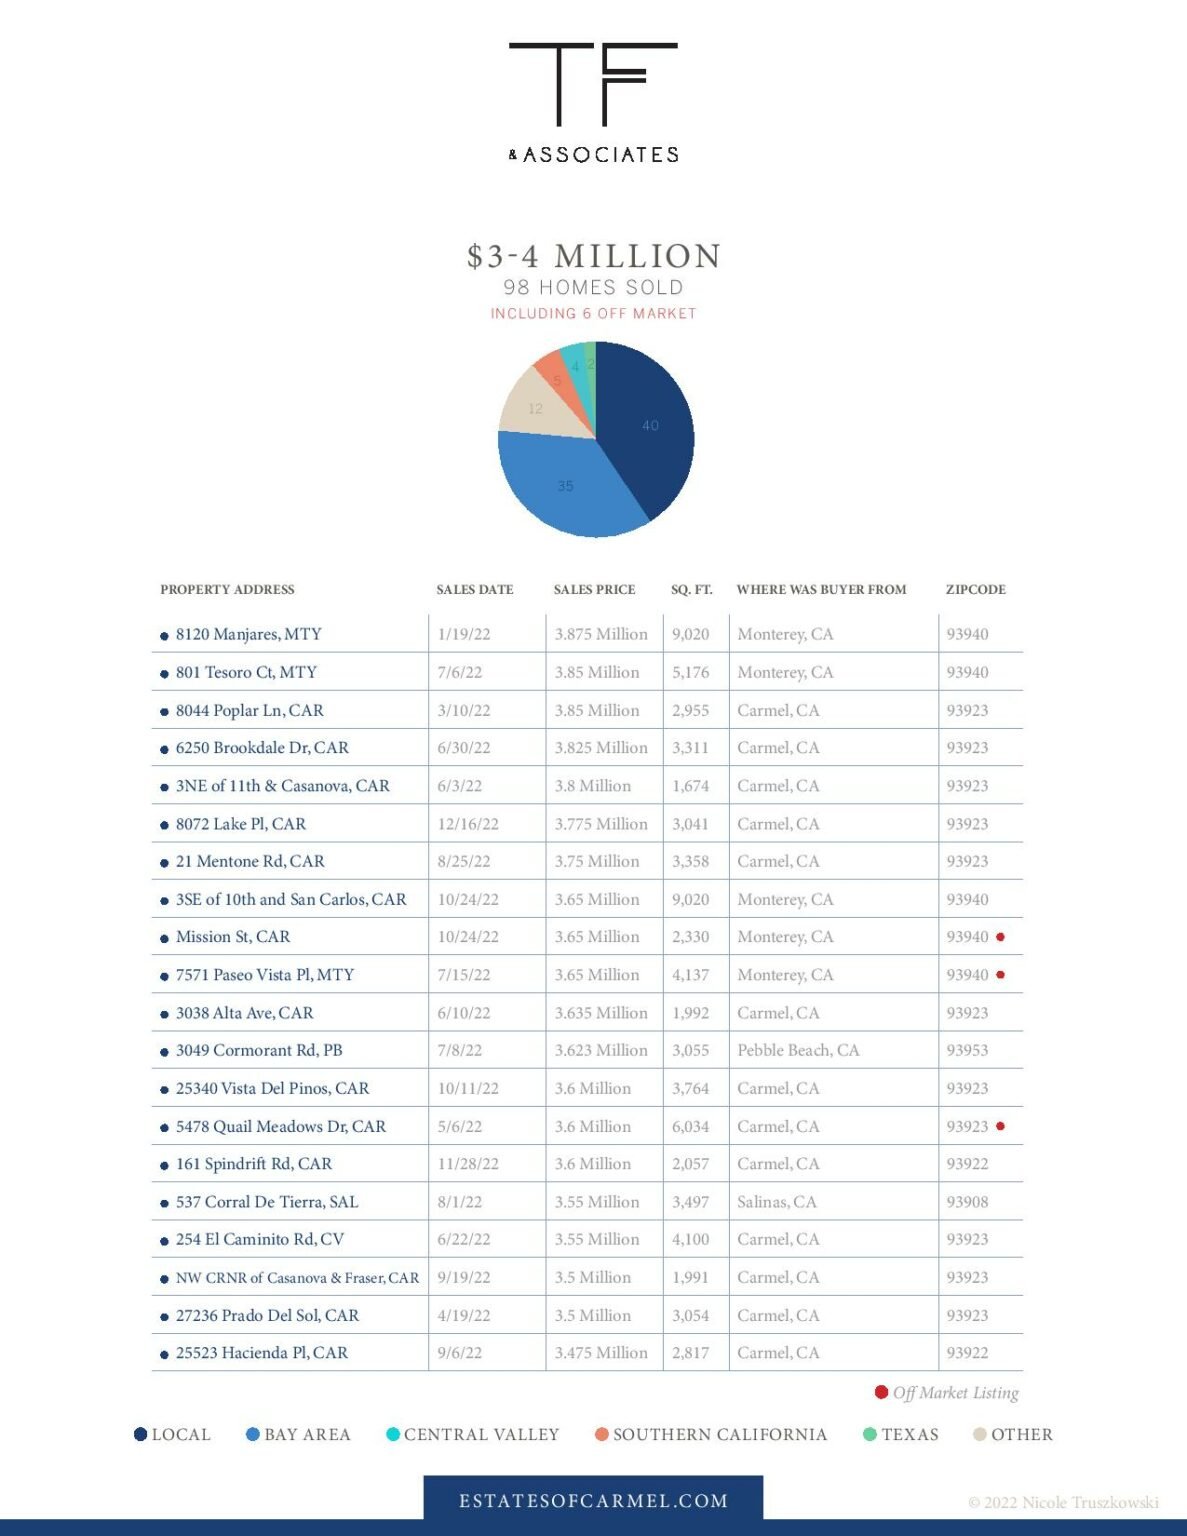
2022 luxury real estate sales table for $3–4 million properties, with buyer origins and a color-coded regional legend.
 
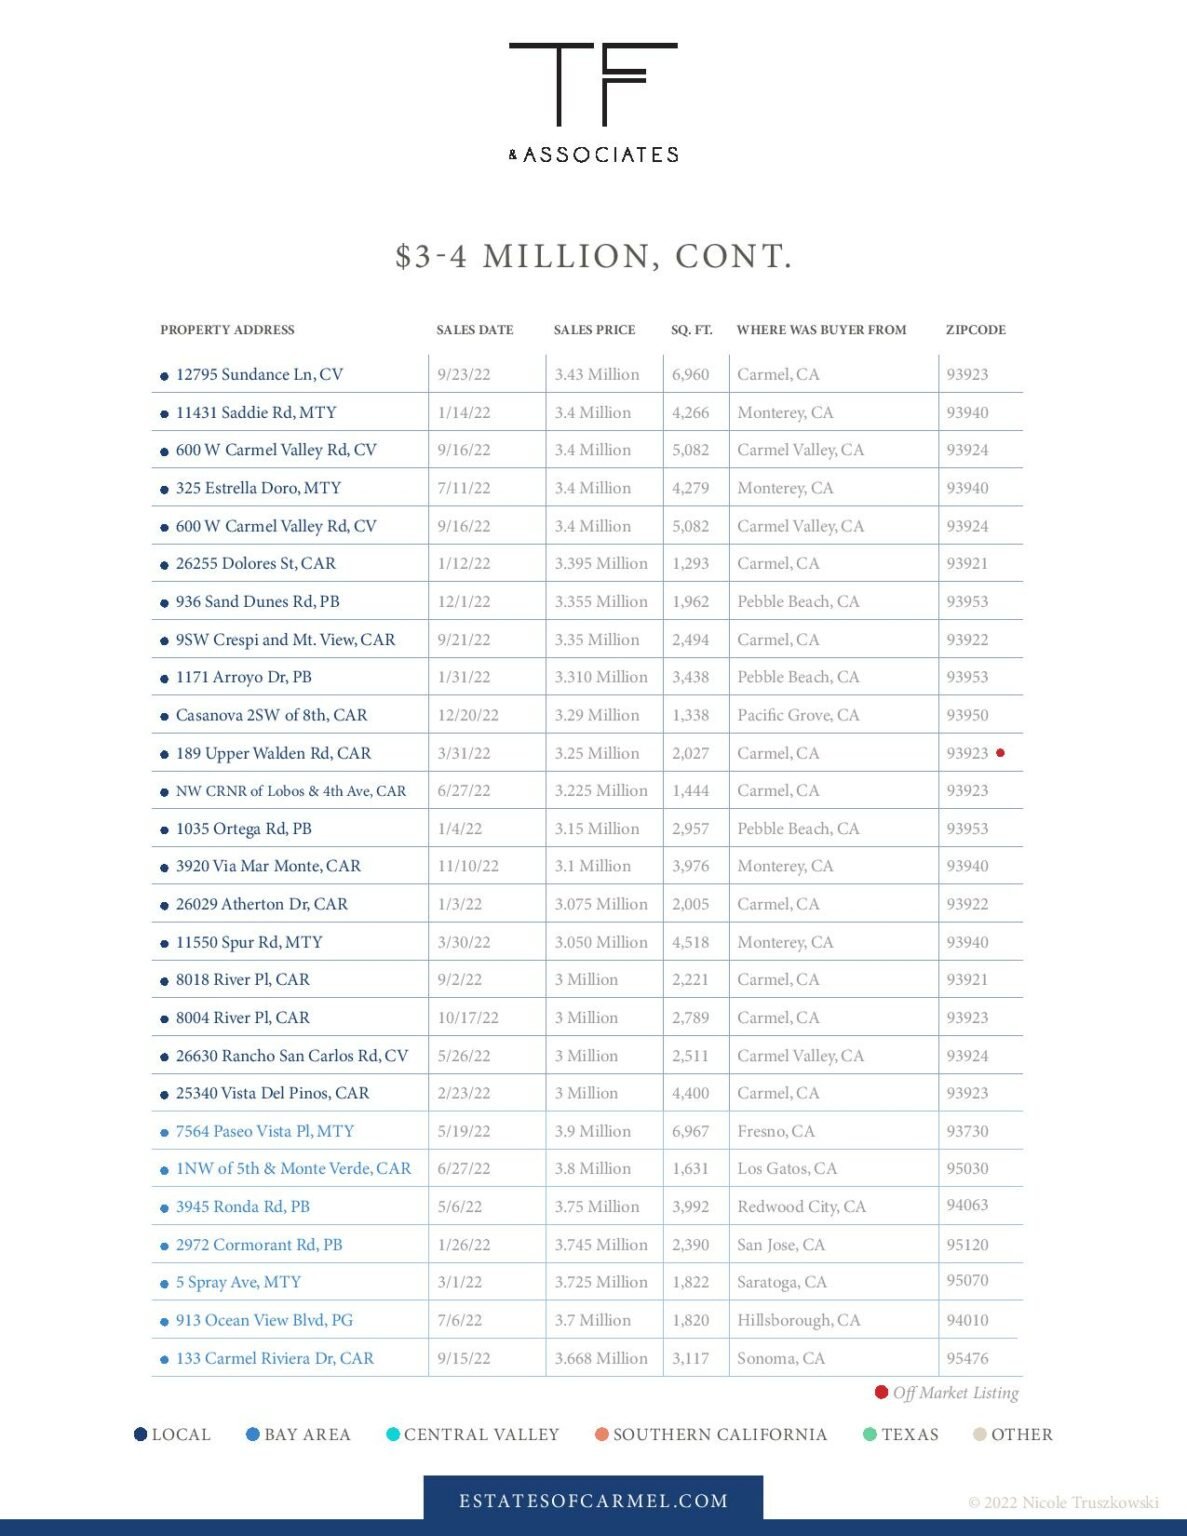
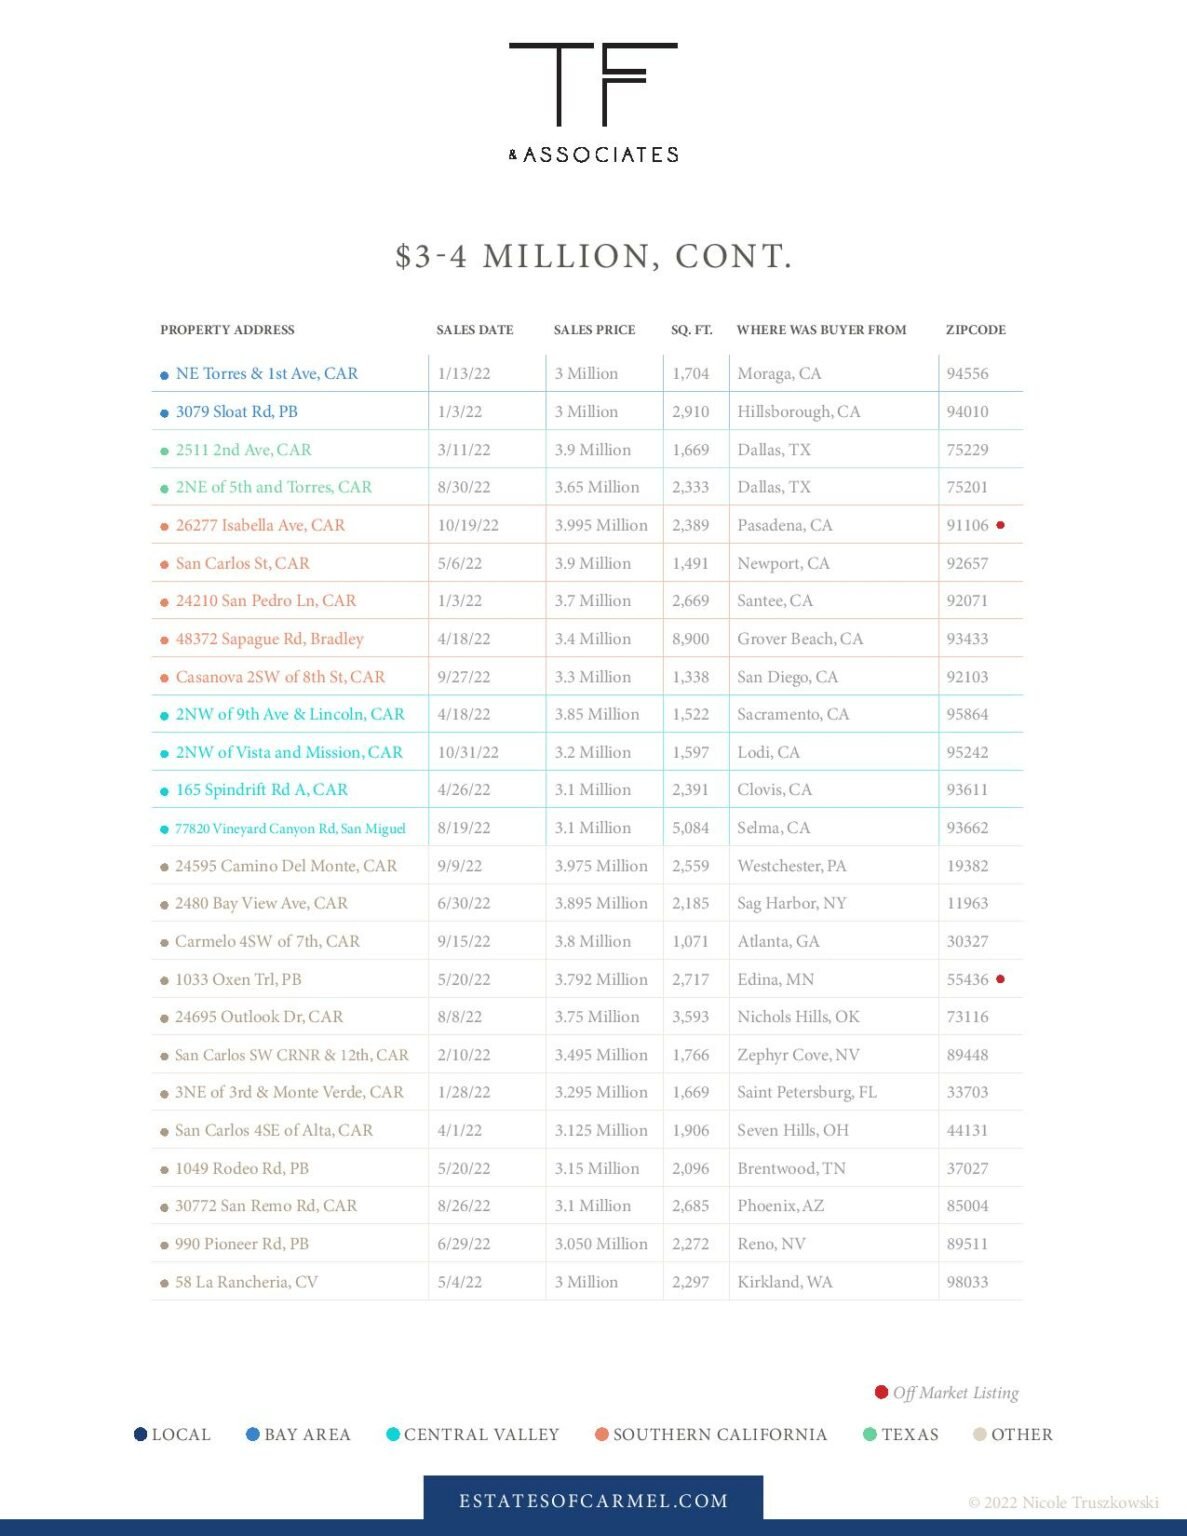
2022 luxury home sales table for properties priced between $3 million and $4 million.
 
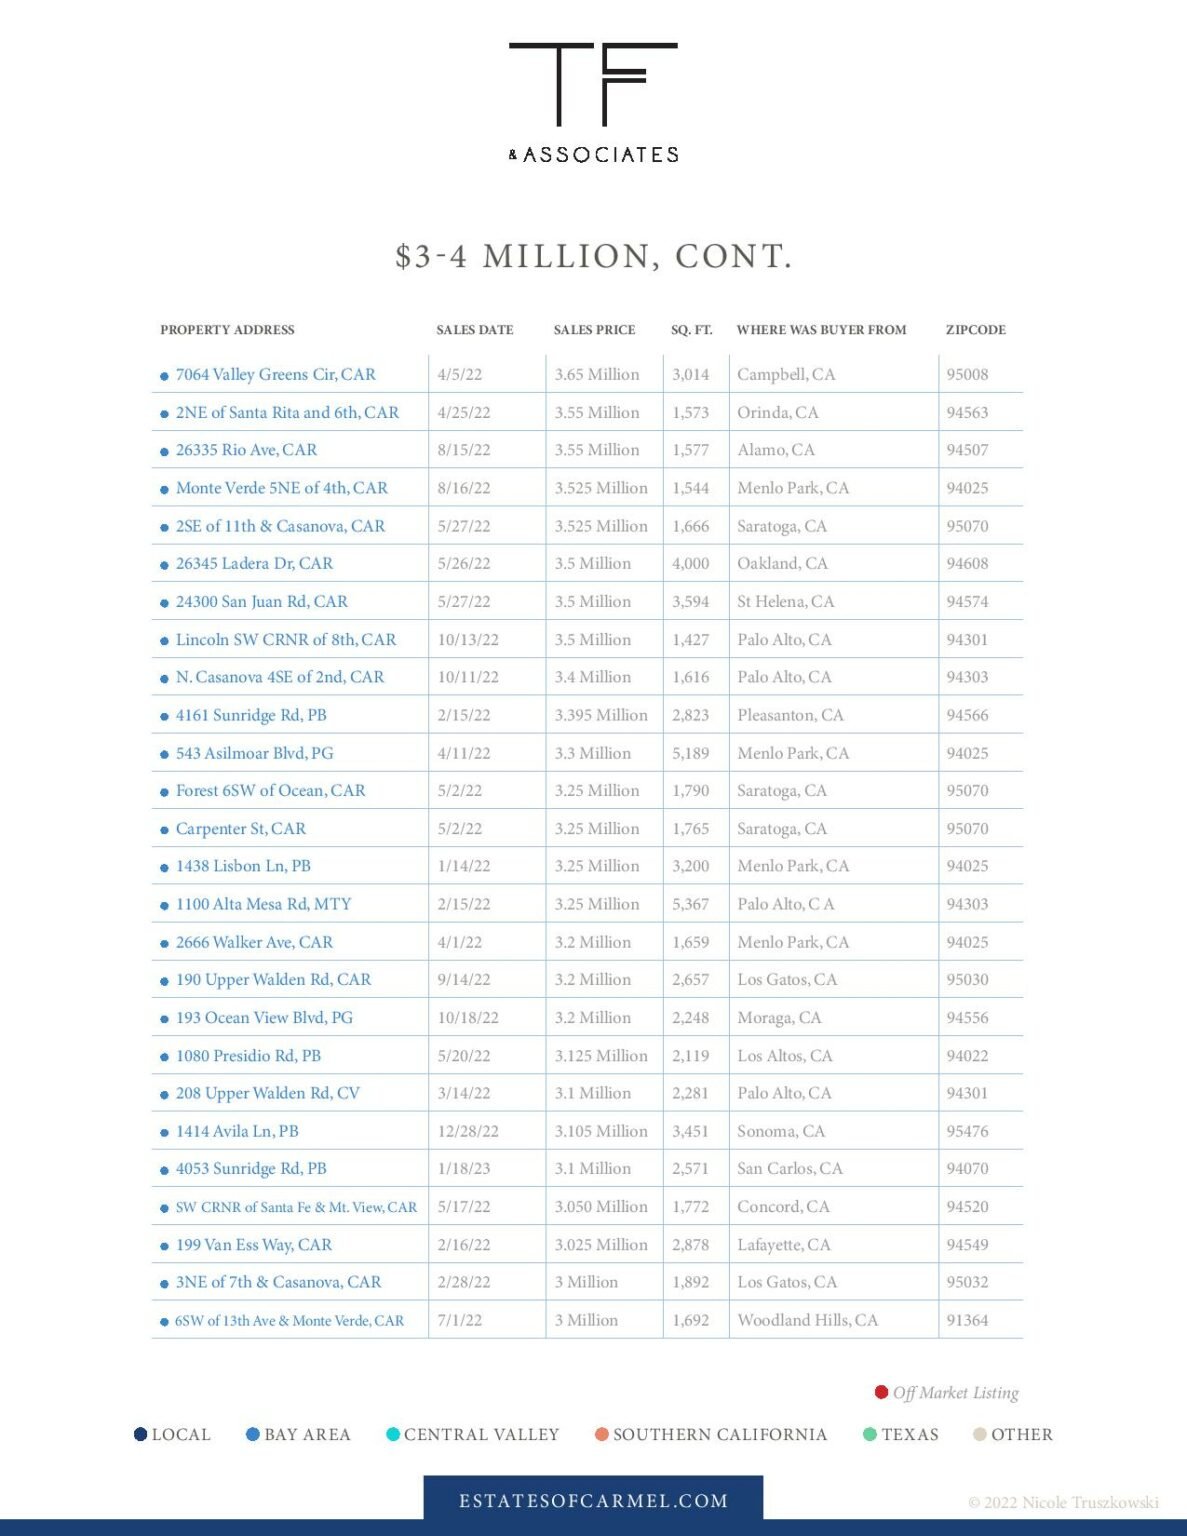
2022 luxury real estate sales table for properties priced $3–4 million, with sale details and a color-coded regional legend.
 
Luxury real estate sales infographic showing a $4–5 million market chart and color-coded home sales table.
 
Luxury real estate sales table for properties priced $4–5 million, with buyer origins and an off-market listing key.
 
2022 luxury real estate sales infographic with a buyer-origin pie chart and table of 20 property sales.
 
Color-coded table of 2022 luxury home sales, listing addresses, prices, sizes, buyer locations, and ZIP codes.
 
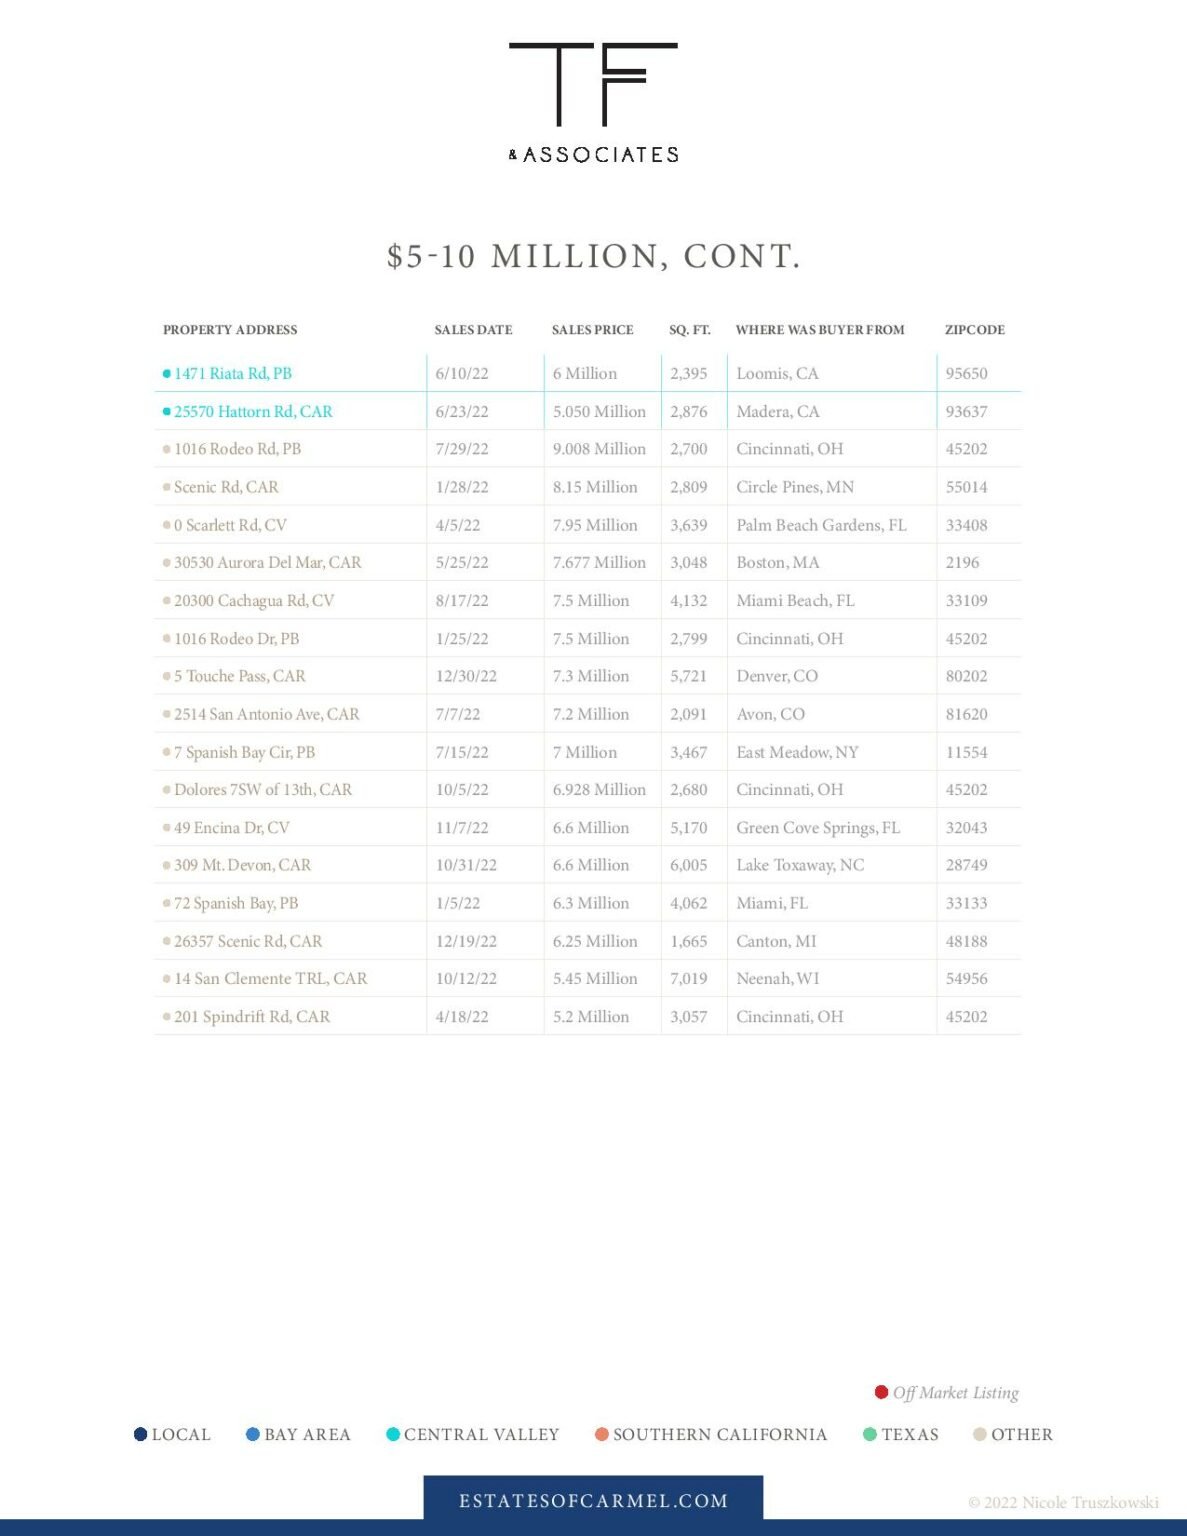
2022 luxury property sales table for homes priced from $5 million to $10 million.
 
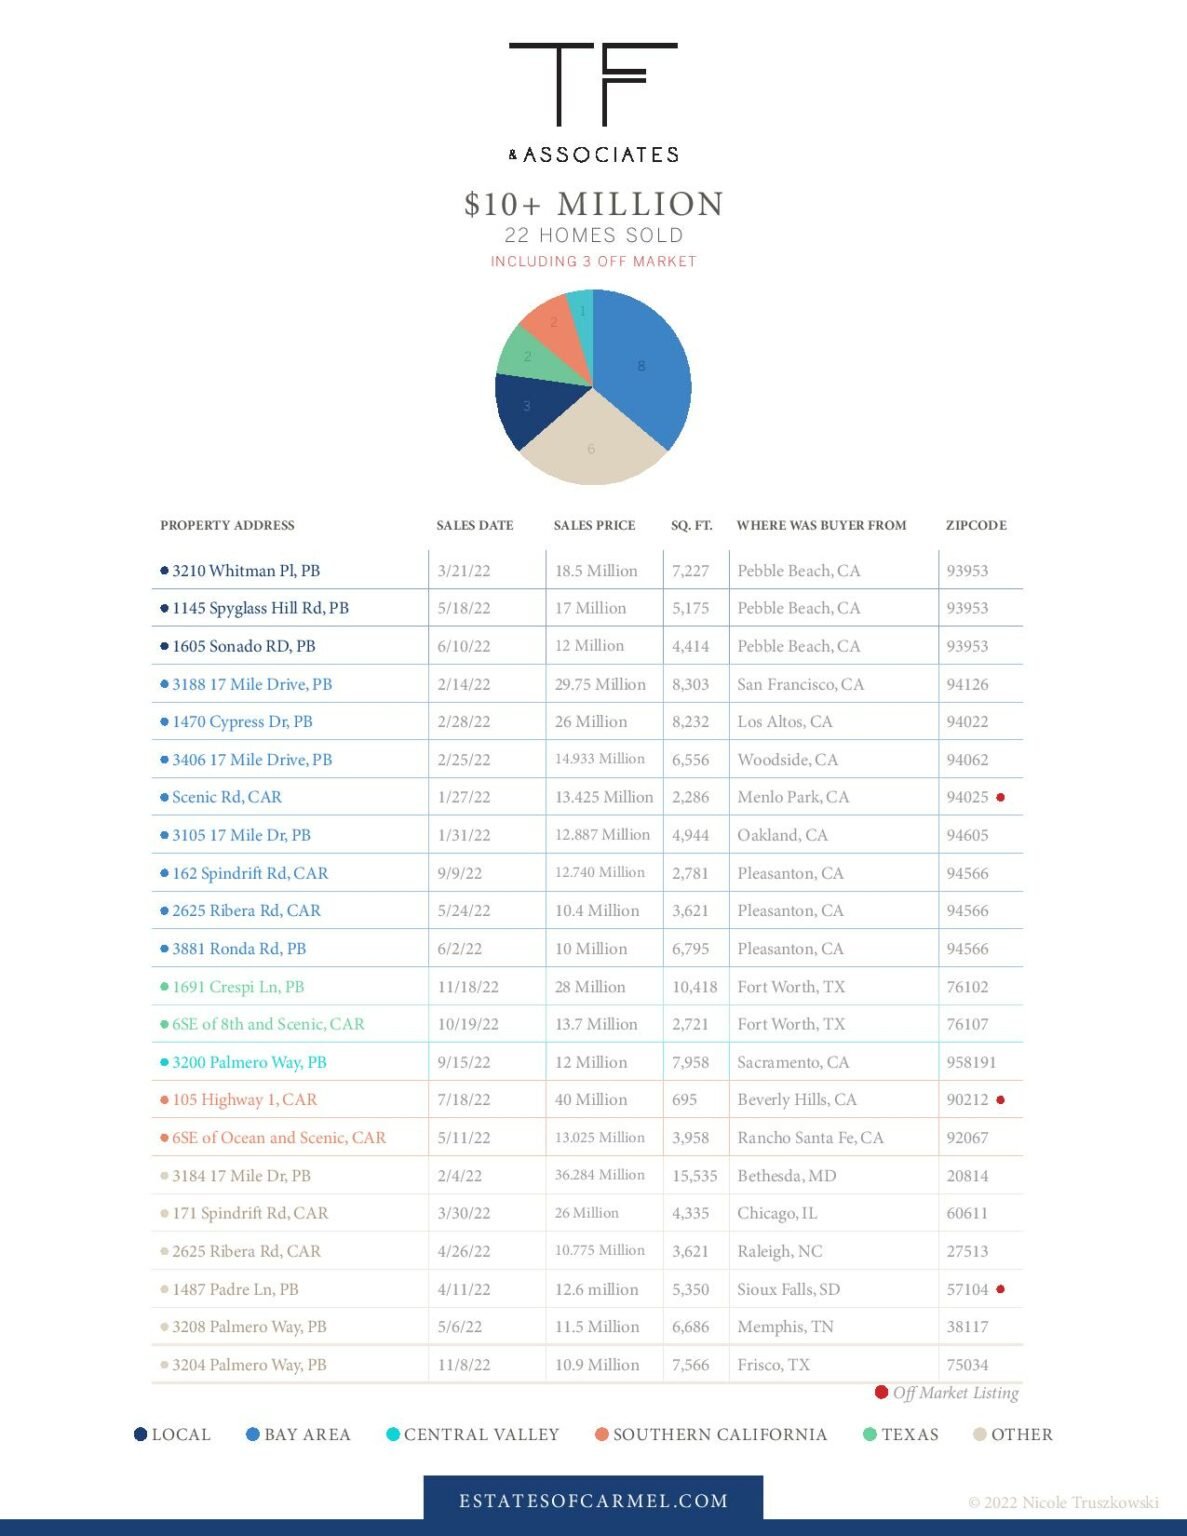
2022 luxury home sales infographic with a regional pie chart and property sales table.
 
Infographic comparing real estate sales by location and price range from 2014 to 2022.
 
Charts compare total and off-market sales from 2014–2022 in a luxury real estate report.
 
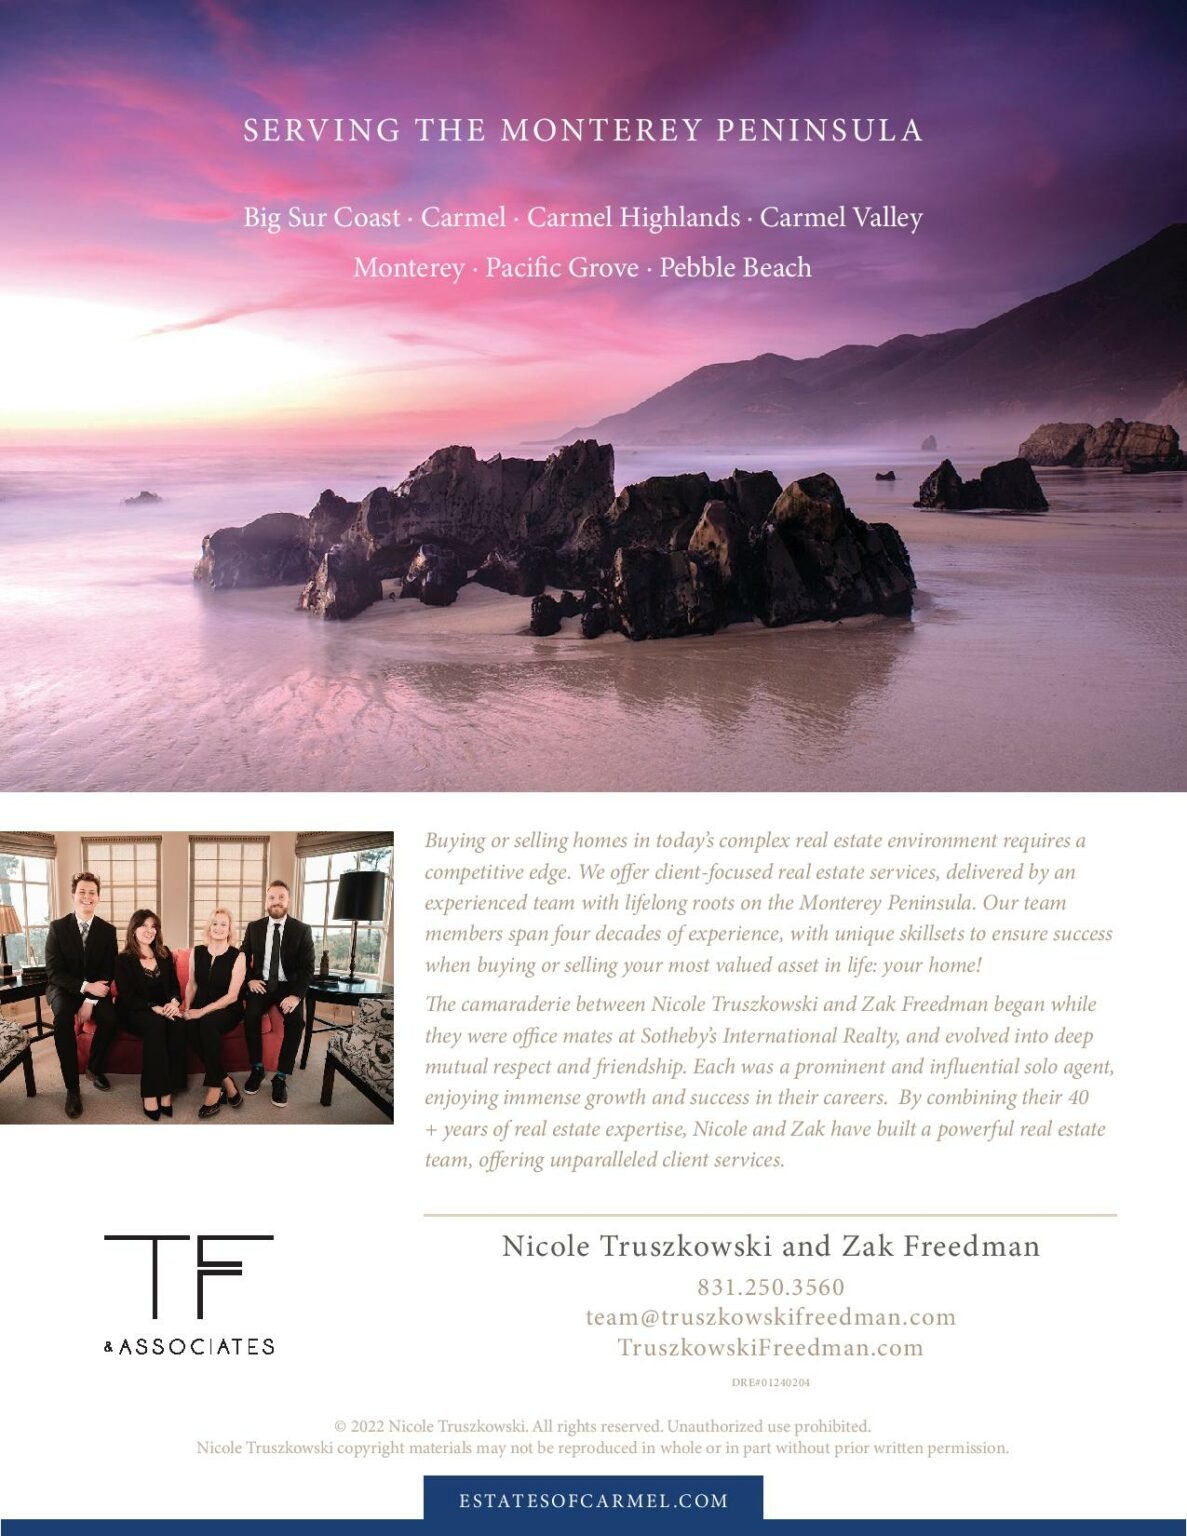
Truszkowski Freedman & Associates Monterey Peninsula real estate flyer with a sunset beach and team portrait.
.

Guiding You Every Step of the Way

Work With Us

Market Insights & Home Tips

Join Our Mailing List

Work With Us

Featured In